Is Eclipse Ready for the Precision Matrix?
Especially in head and neck RT and brain SRT, it is desirable to perform CT imaging with high spatial resolution, as some structures (small brain lesions, lymph nodes, vessels, etc.) are small. If the scan field of view (sFOV) is adjusted to the head diameter, this would provide sufficient detail for contouring at the standard image size of 512x512 pixels. On the other hand, to avoid dosimetric errors due to neglected absorption, CT imaging for treatment planning requires the sFOV to capture not only the patient's anatomy but also all support structures.
At our institute, the head/neck sFOV was and is therefore selected to be quite large: for the AquilionLB, it was typically 750 mm, and for the go.Open Pro, 600 mm. This resulted in the seemingly paradoxical situation that a scan in the head/neck region had a larger sFOV than a scan in the pelvic region.
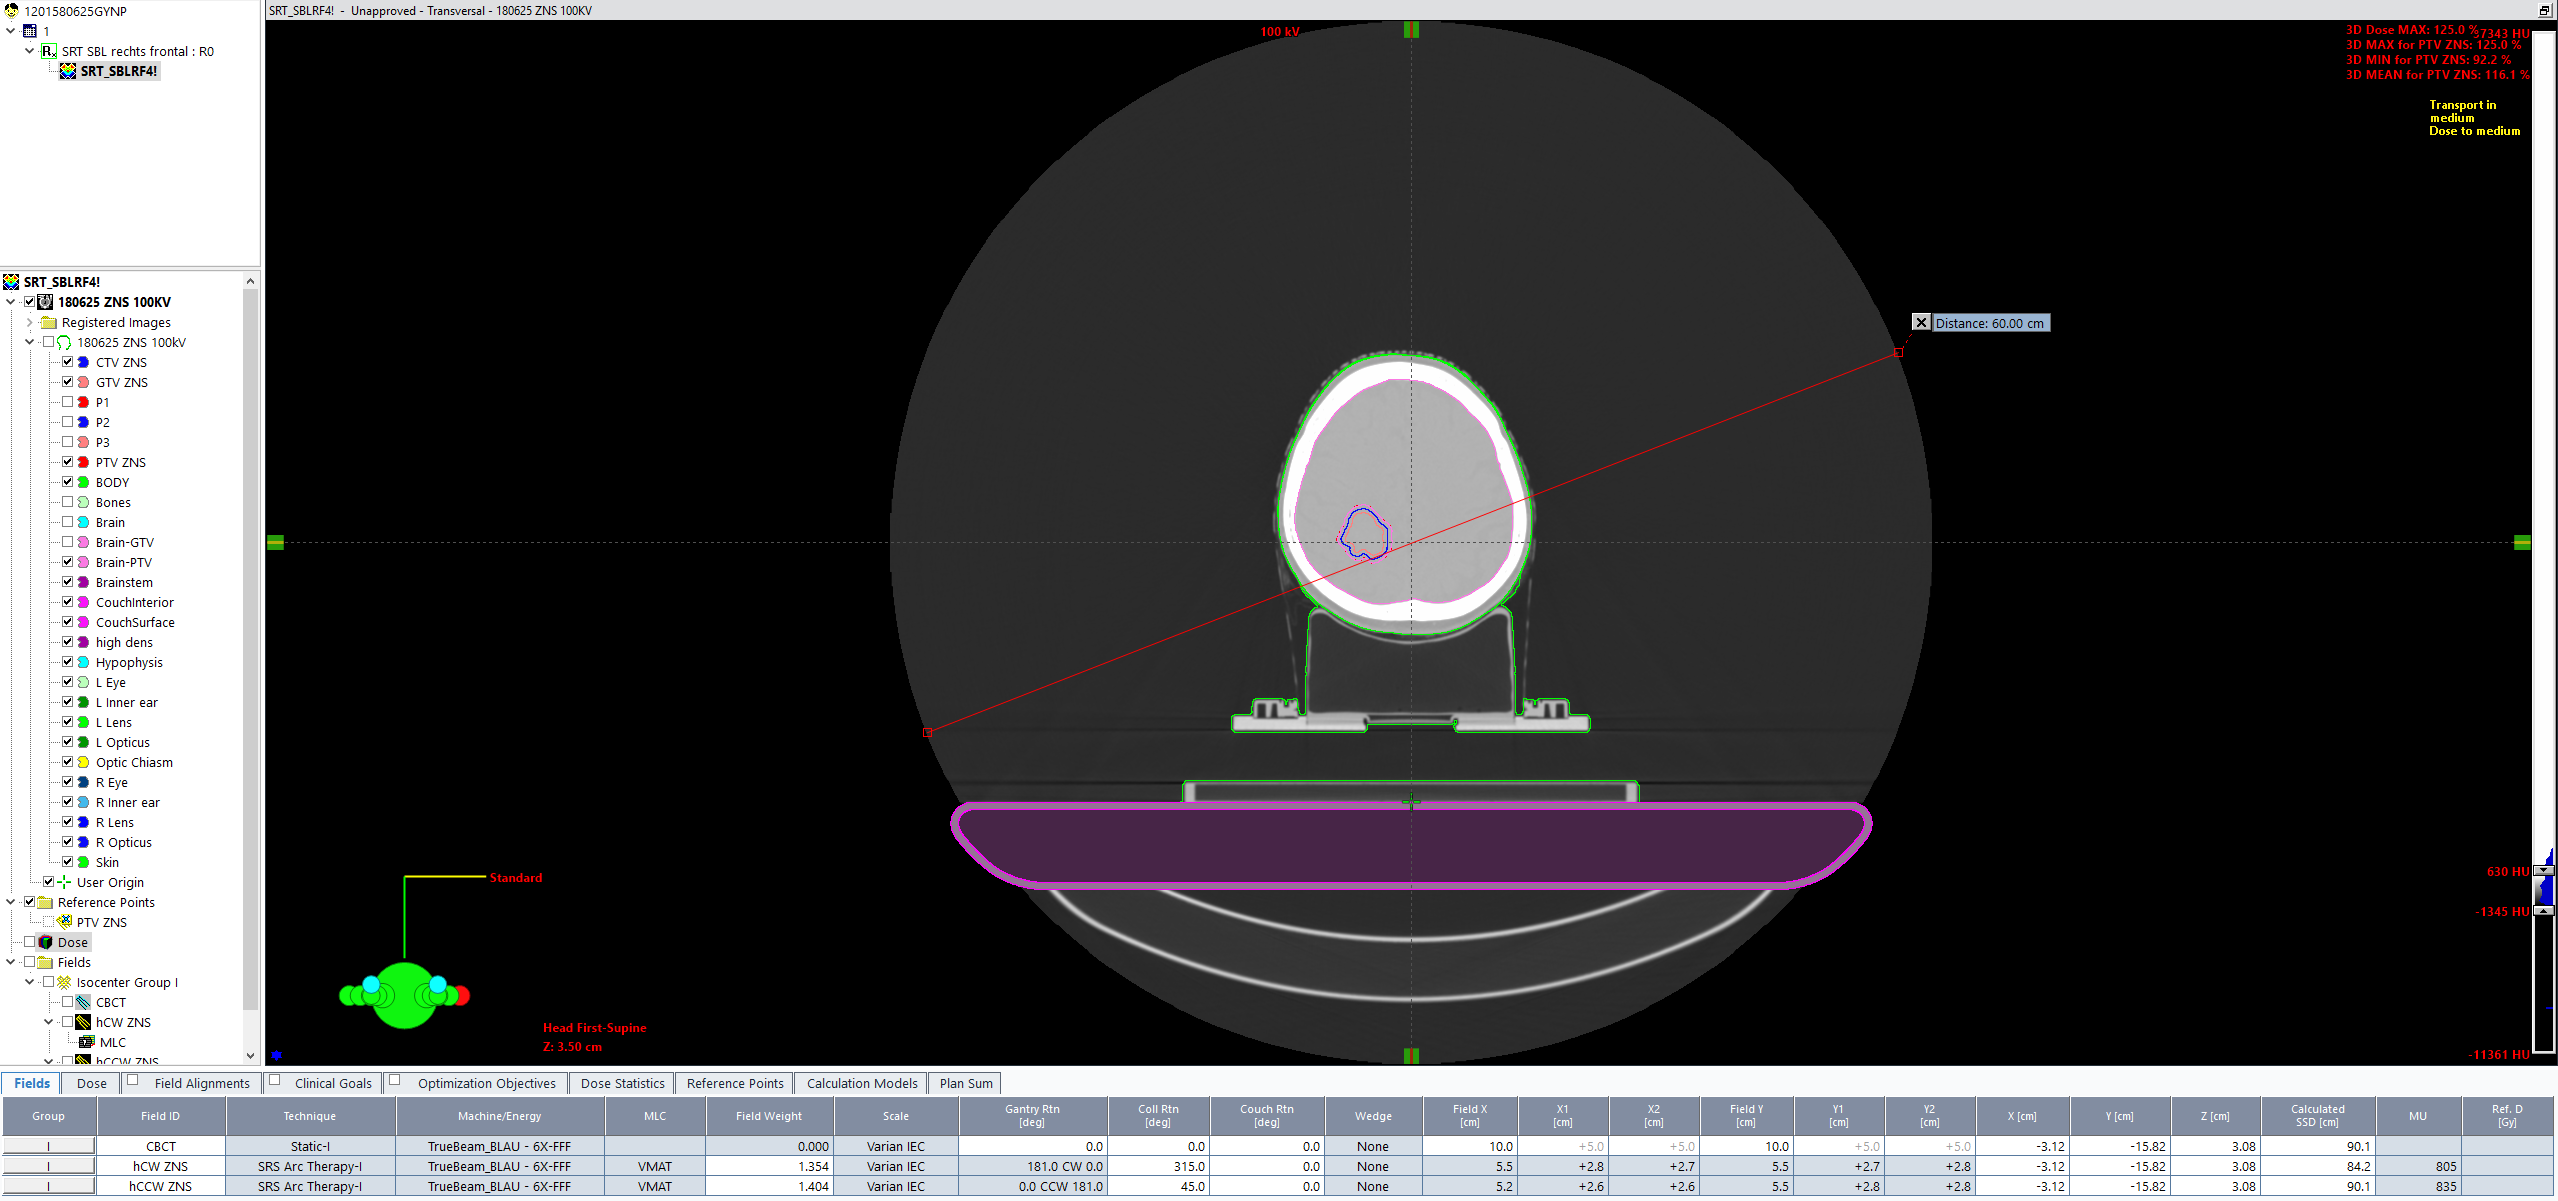
(Non-HyperArc scan for brain SRT on the SOMATOM go.Open Pro. The sFOV is 600 mm.)
To calculate the size of an image pixel, one simply needs to divide the sFOV in mm by the matrix size (512 px). For the AquilionLB, the largest (XL) sFOV resulted in a pixel size of 1.46 x 1.46 mm, while for the go.Open Pro, it is 1.17 x 1.17 mm. Considering that a slice thickness of 1 mm is typically chosen for SRT planning, this means that the spatial resolution in the scan plane (X/Y plane) is lower than in the Z direction. And it may be too coarse for precision contouring.
What is the Precision Matrix?
One of the innovations introduced by our new CT scanner is called the Precision Matrix (PM). The PM license allows for the reconstruction of images with a maximum matrix size of 1024 pixels, doubling the spatial resolution. The resulting pixel size is 0.6 mm, even with the 600 mm sFOV:
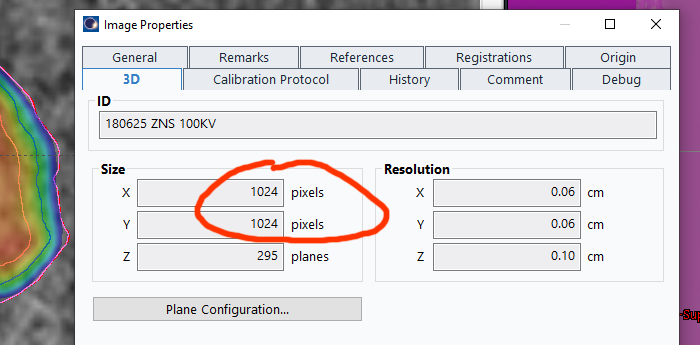
(PM images can be identified in Eclipse via Image Properties of the 3D image.)
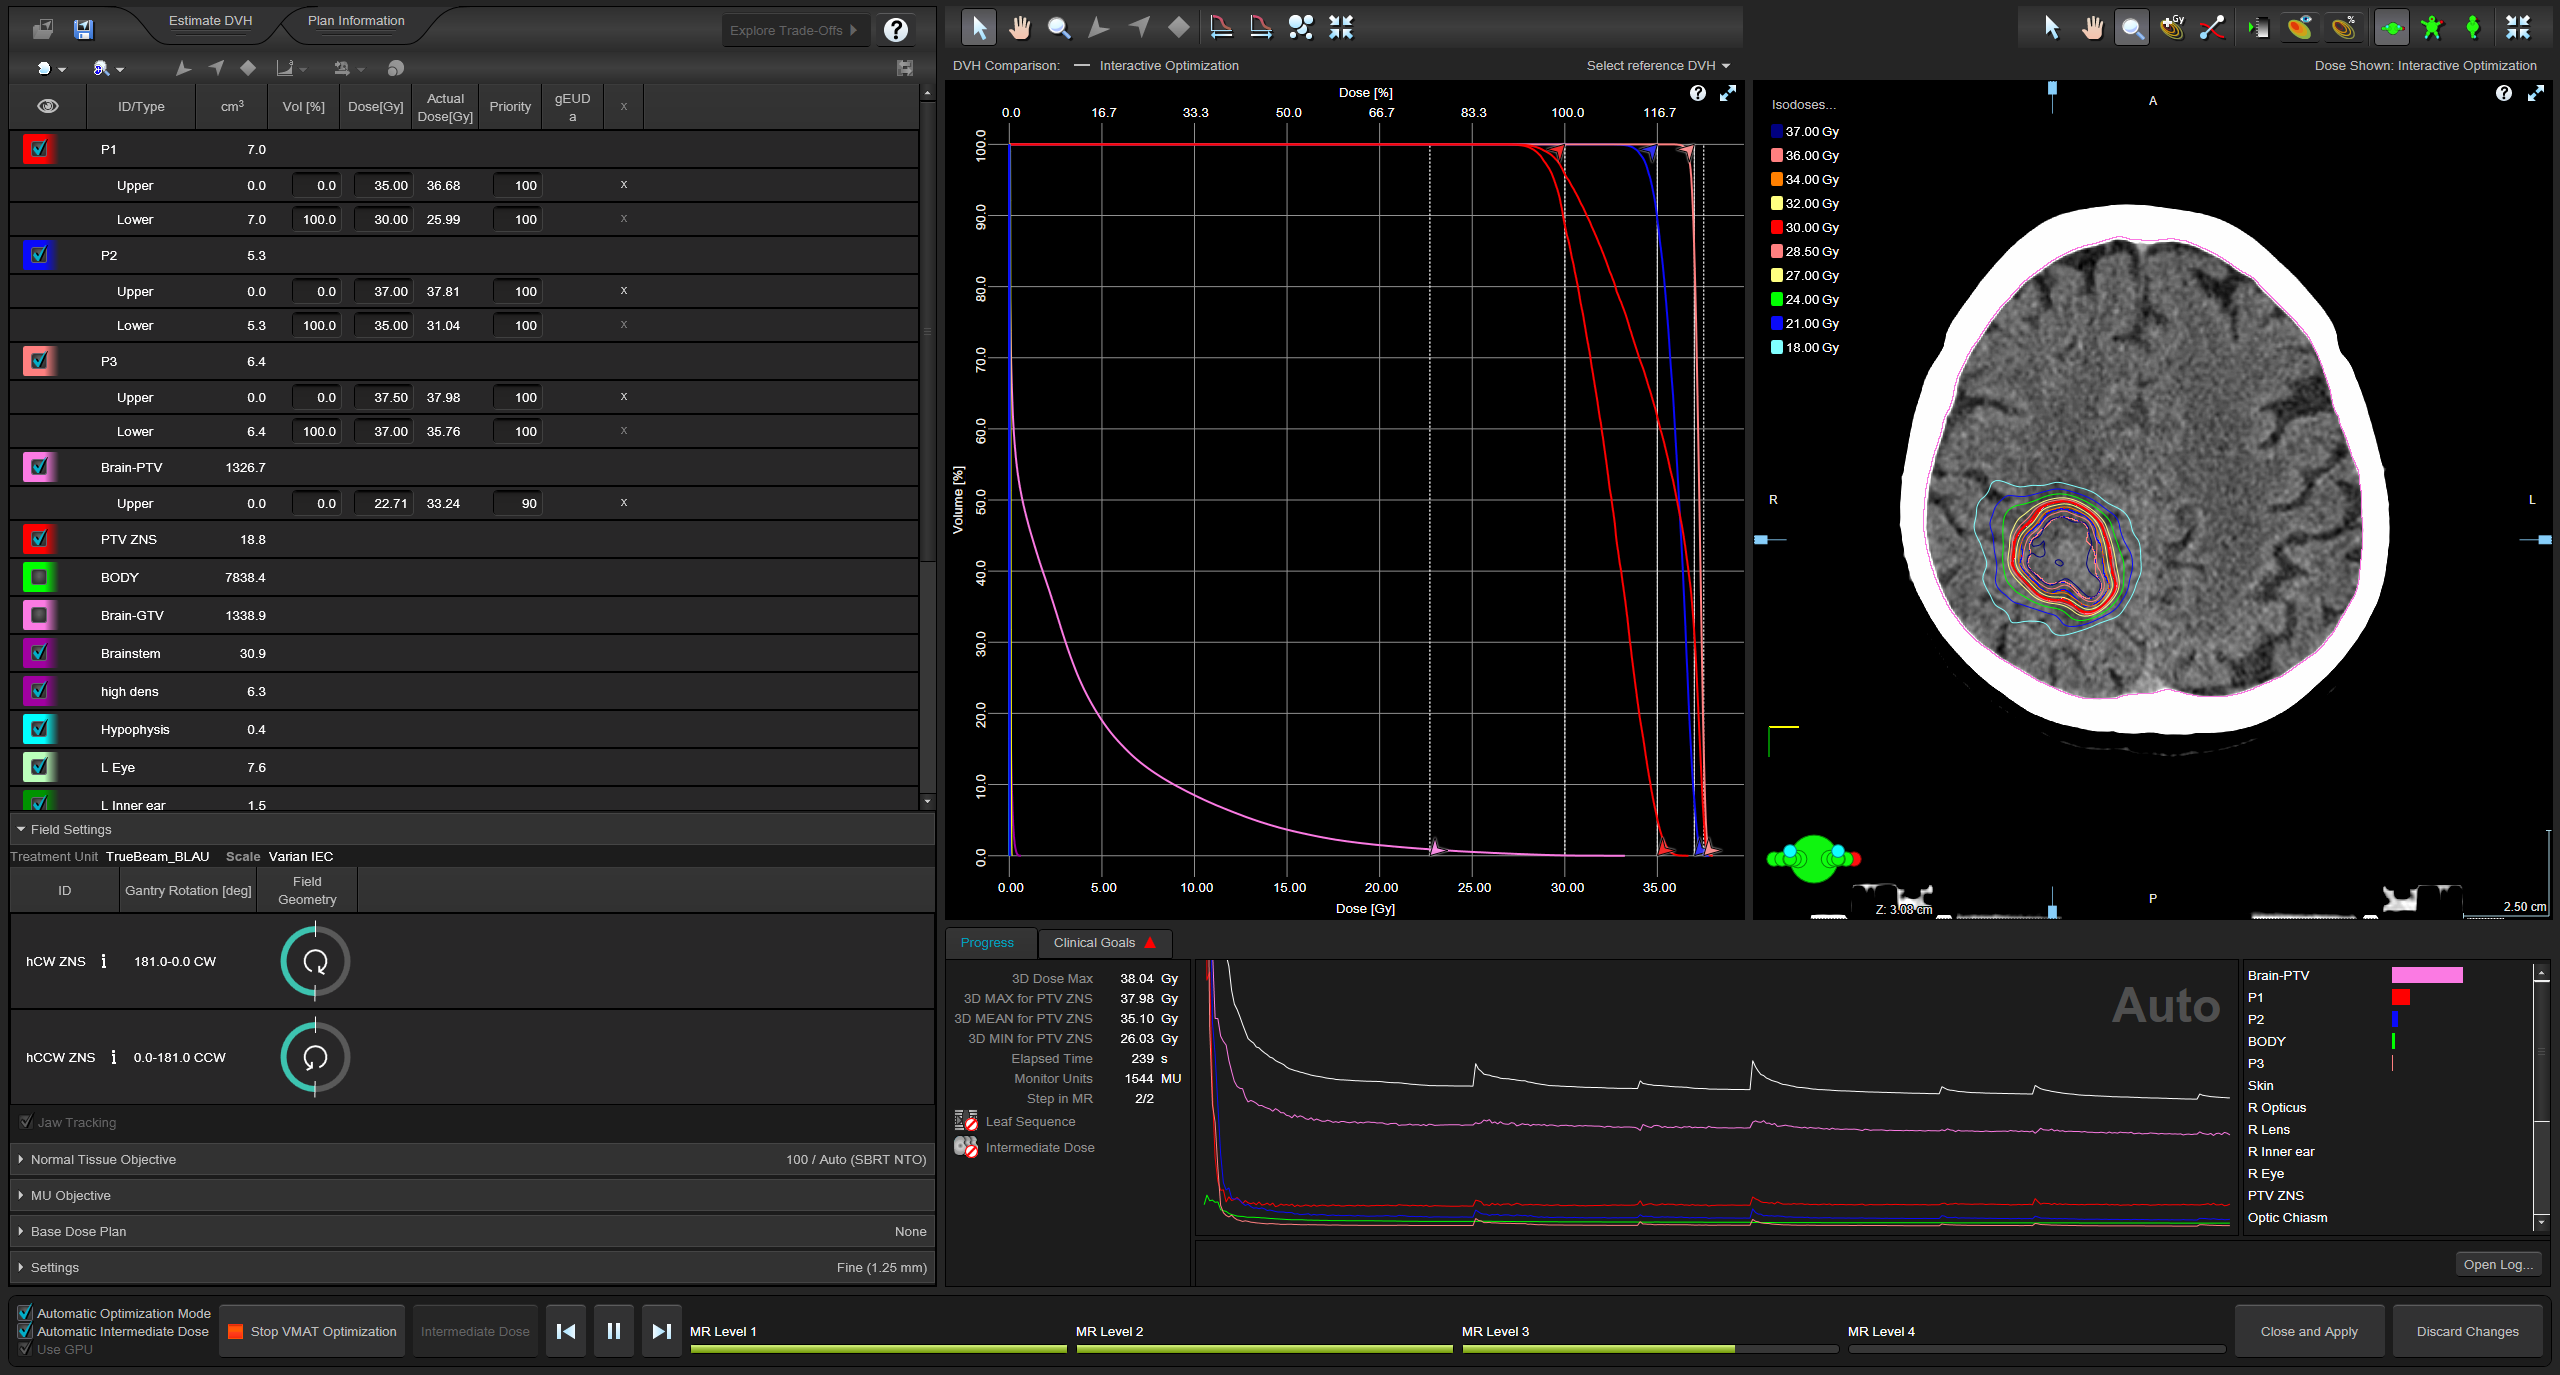
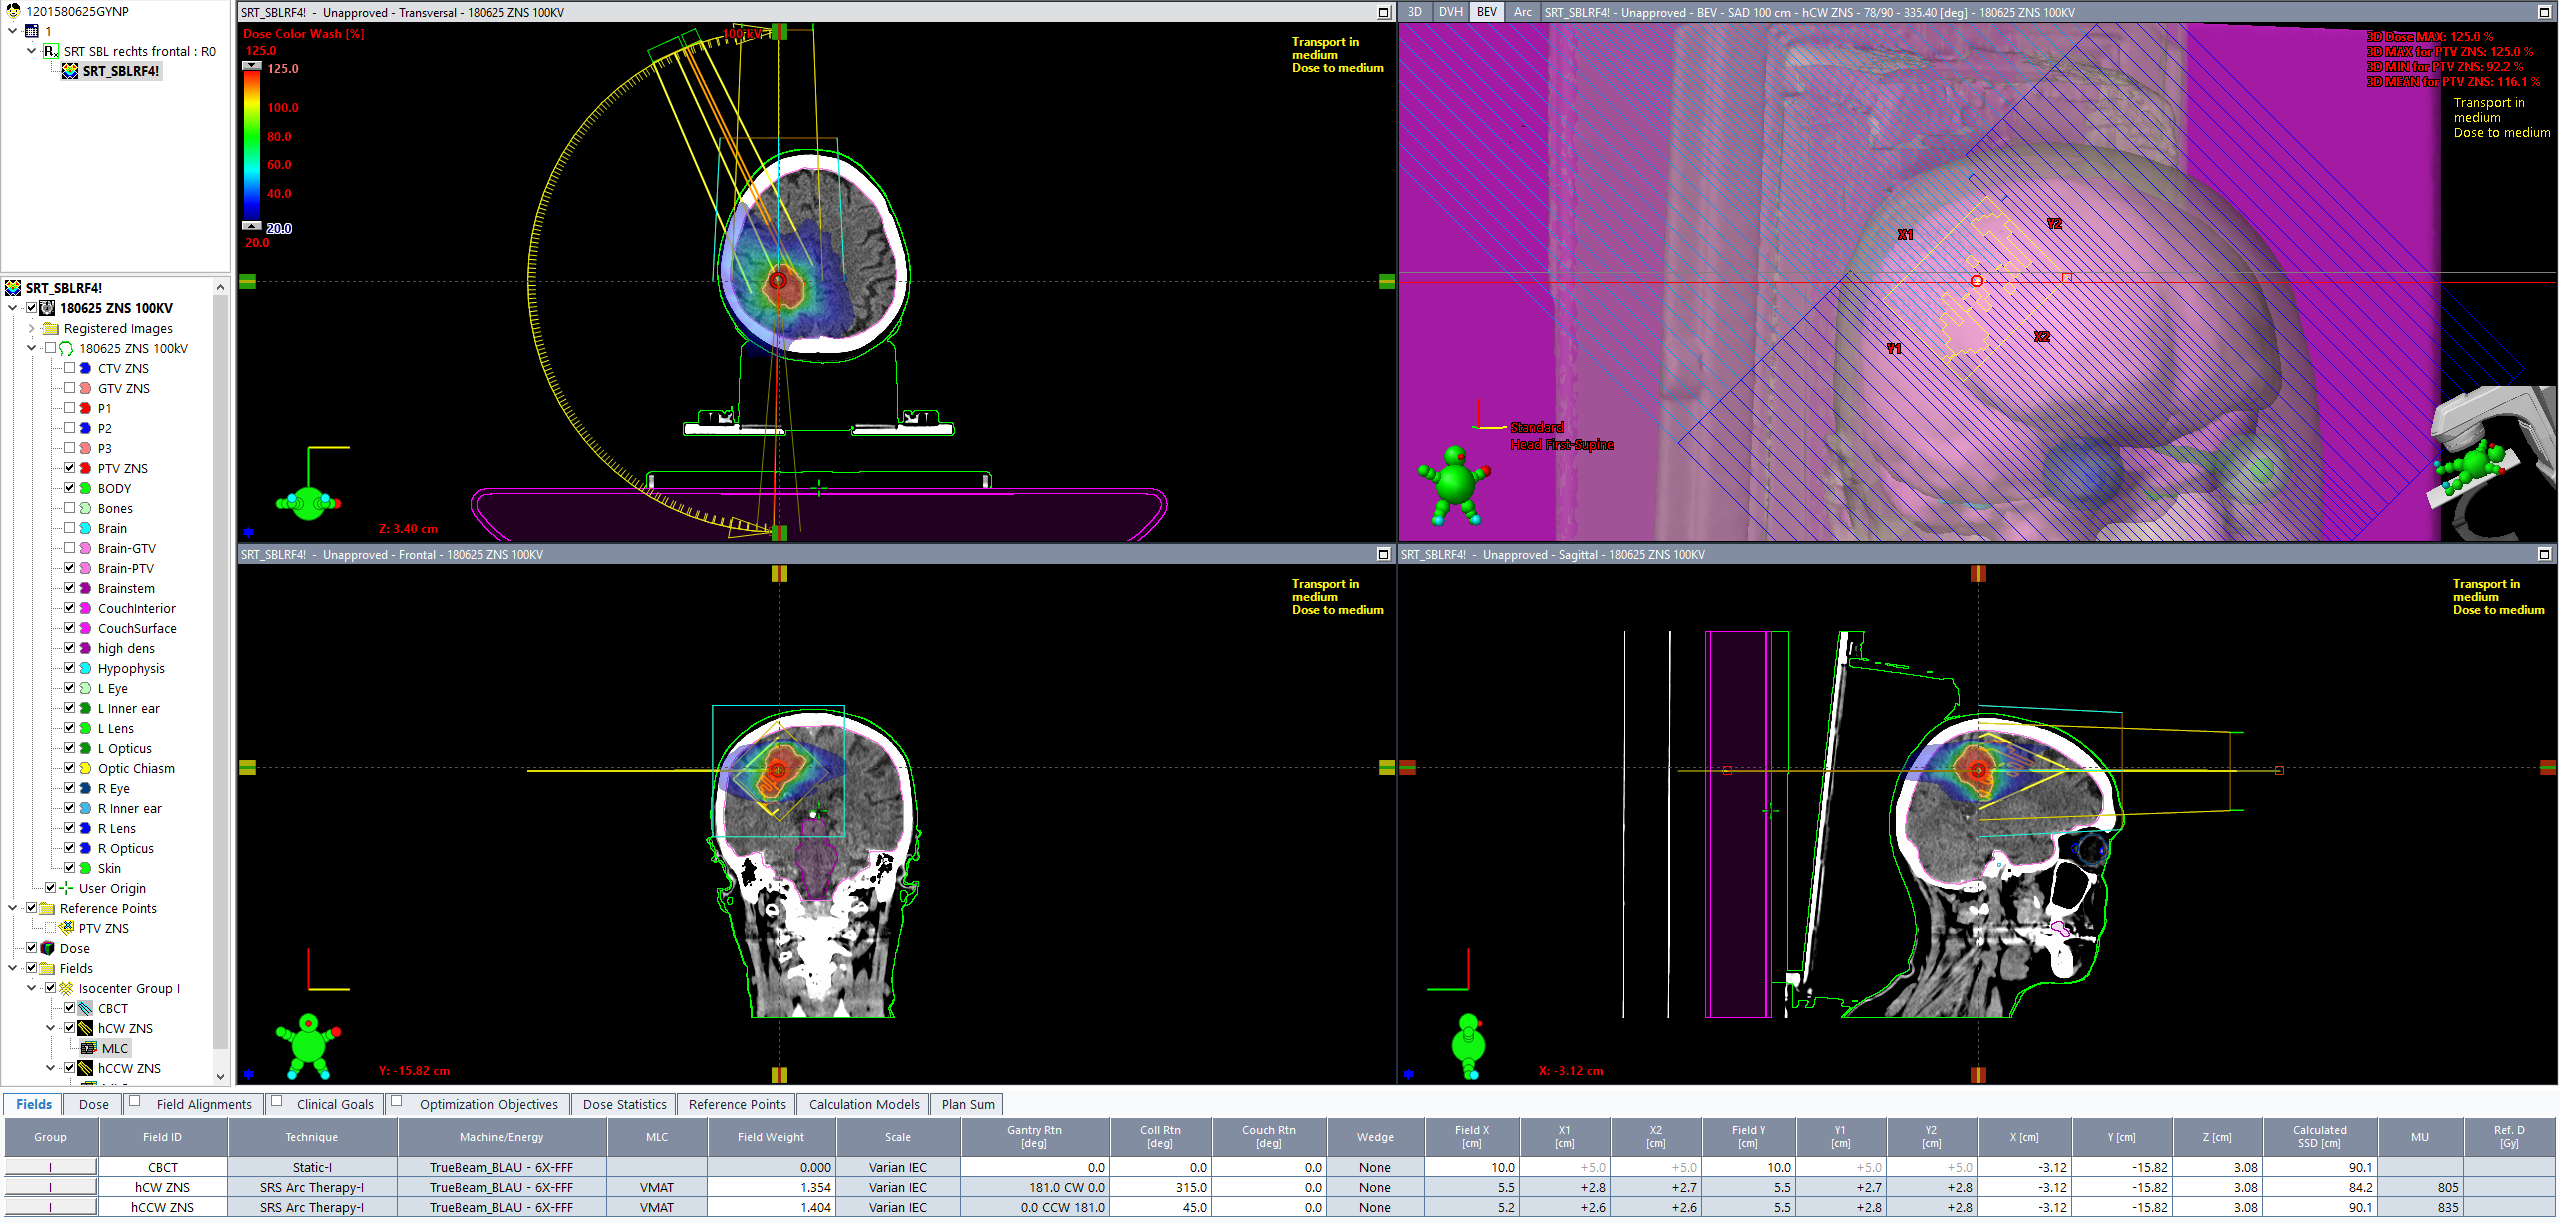
On the go.Open Pro, we configured the brain SRT protocol so that reconstruction is performed with PM and 1 mm slice thickness, as shown in the Eclipse screenshot.
Eclipse Innovations
An innovation that came with Eclipse 18.1 is the "free choice" of tube voltage, other than the "standard" 120 kV. As already mentioned in the article about DirectDensity, Eclipse 18.1 now supports up to 20 sets of calibration curves per scanner. We configured the "goOpenPro" for 70 - 140 kV:
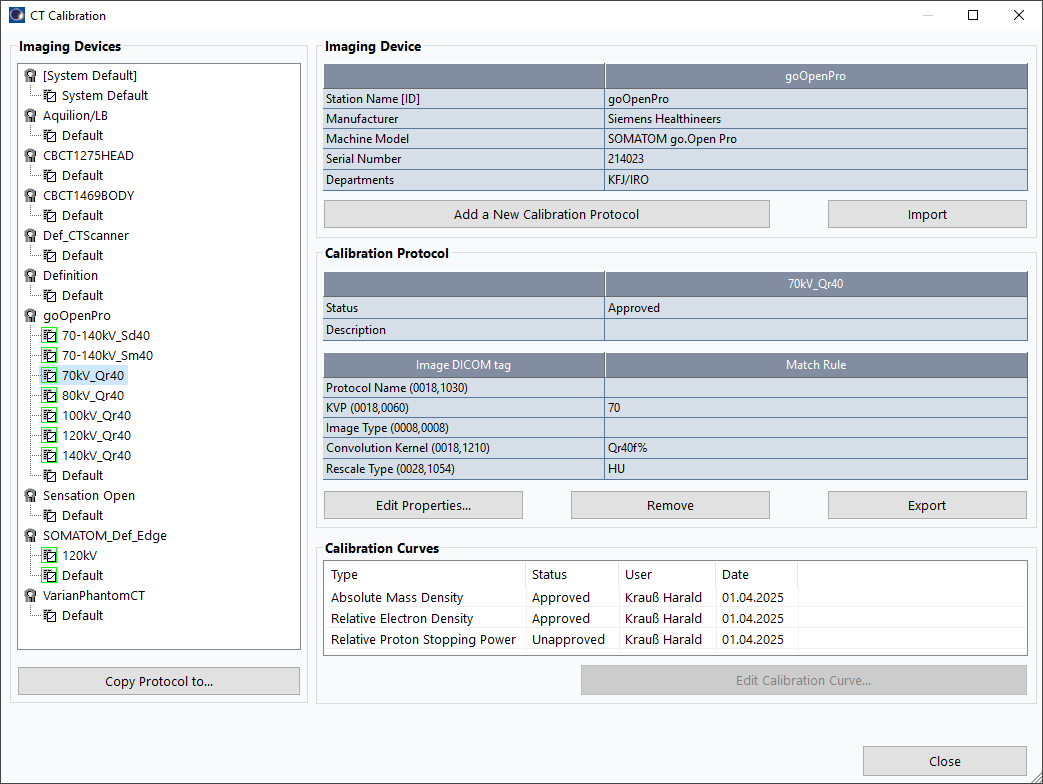
(Match rules provide an automatic assignment of the correct calibration curves.)
For the scan, the optimal tube voltage can be either selected manually or, more conveniently, the system can decide which tube voltage to use via CARE kV.
A Max-Resolution End-to-End Test
To answer the question posed at the beginning, we want to perform a pre-treatment end-to-end test with maximum resolution in all steps:
- CT scan with Precision Matrix (1024 px) and 1 mm slice thickness
- Optimization with the Photon Optimizer (PO) Dose calculation resolution for SRS or HyperArc™ set to "High"
- PO Structure Resolution set to "Fine (1.25 mm)"
- AcurosXB Calculation resolution for SRS or HyperArc™ set to the minimum of 0.1 cm
- VERIQA dose calculation with 1 x 1 x 1 mm voxel size
- VERIQA Gamma evaluation with 1%/1mm (5% threshold)
It cannot be ruled out that due to PM, problems may arise during individual steps of this end-to-end test. For example, memory issues during optimization or 3D dose calculation are conceivable. Doubling the image resolution quadruples the memory requirements, which means that loading 295 PM images into memory is the same as loading 1180 slices with the standard-512x512-matrix.
It is also uncertain whether the plan will pass the extremely stringent gamma test (1%/1mm).
For convenience, we also give some timing information.
Results
Using the SRT imaging protocol, the patient was scanned with a tube voltage of 100 kV, to improve image contrast during contouring.
Treatment Prescription to the PTV (size: 18.8 cm3) was 5 x 6 Gy prescribed to the 80% isodose, which gives 37.5 Gy in the center (GTV). Two 6FFF half arcs were chosen. Out of the GTV > CTV > PTV margins, ring structures were created and used for optimization, to get the desired dose distribution.
Optimization (using GPU) with the Photon Optimizer (PO) took 10 min 13 sec for the following steps: MR Level 1 - MR Level 2 - MR Level 3 - MR Level 4 - VMAT Indermediate Dose - MR Level 3 - MR level 4. This is an impressive speed, considering the use of the Precision Matrix and the finest structure resolution.
Plan dose calculation (again using GPU) took1 1 min 17 sec (295 slices, 1 mm grid):
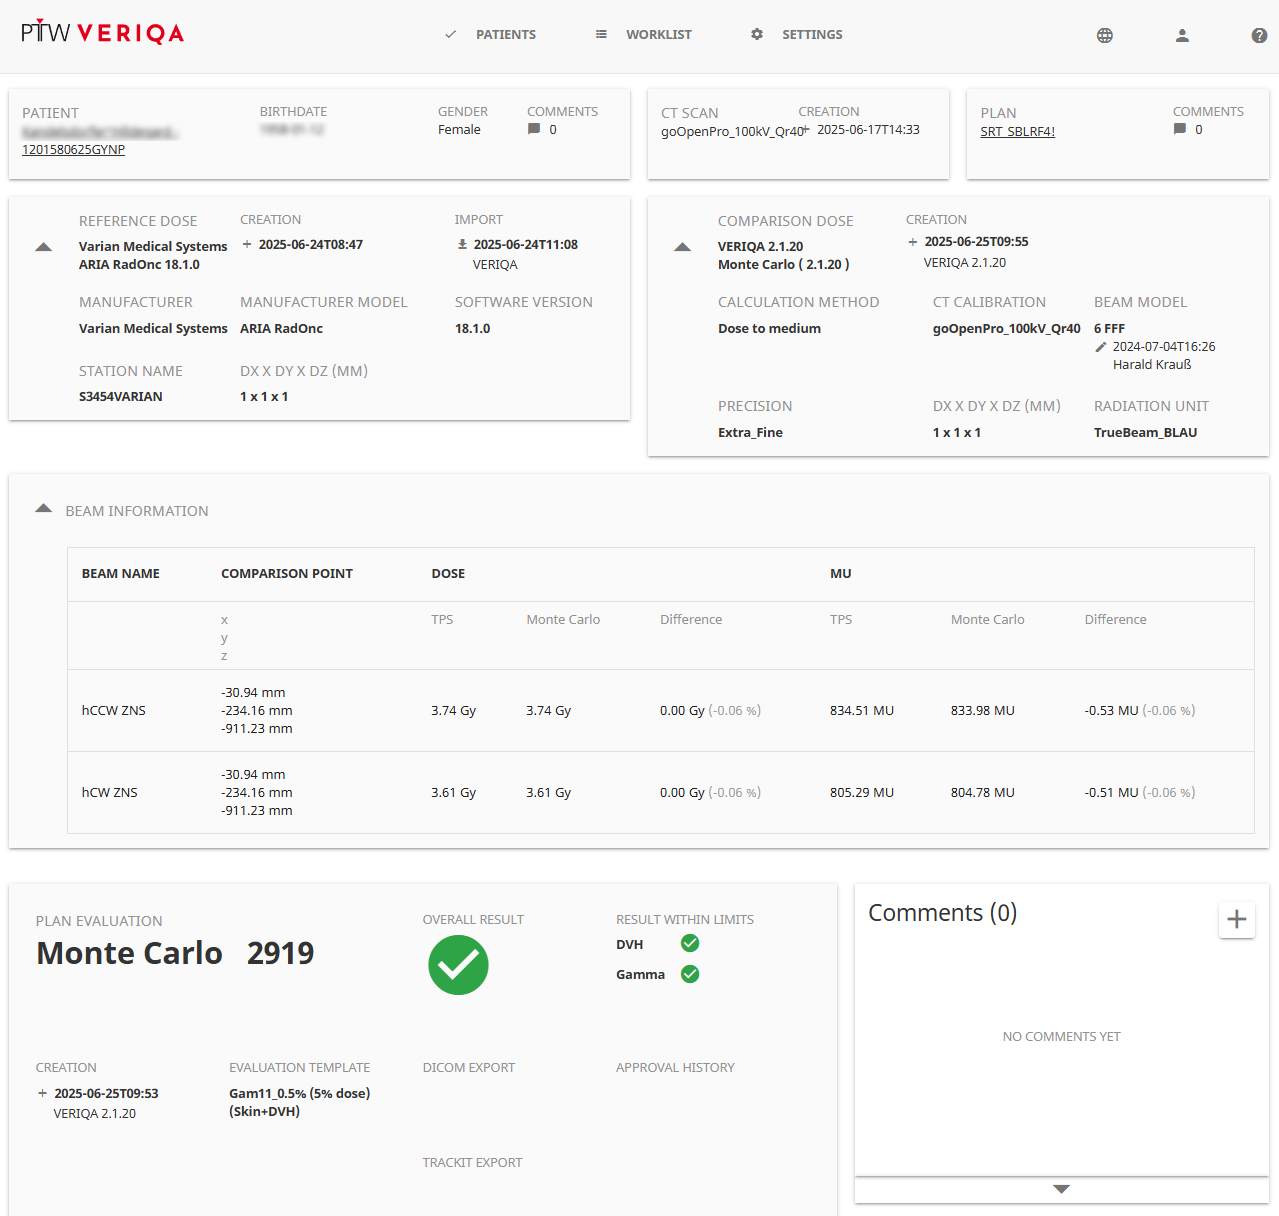
Next step in the end-to-end test is to send it to VERIQA for secondary dose calculation2.
The whole process including evaluation and reporting took3 5 min 20 sec, with the precision set to Extra_Fine (0.5%) and using the TPS grid (1 x 1 x 1 mm voxel size).
Amazingly, the Gam11 test (5% cutoff) was passed with a pass rate of 99.98% for the Skin structure (only the patient, no support structures):
We also evaluate the mean dose deviation for the targets, which is 0.66% for the plan target volume "PTV ZNS" (the structure named "Brain-PTV" is actually a control structure):
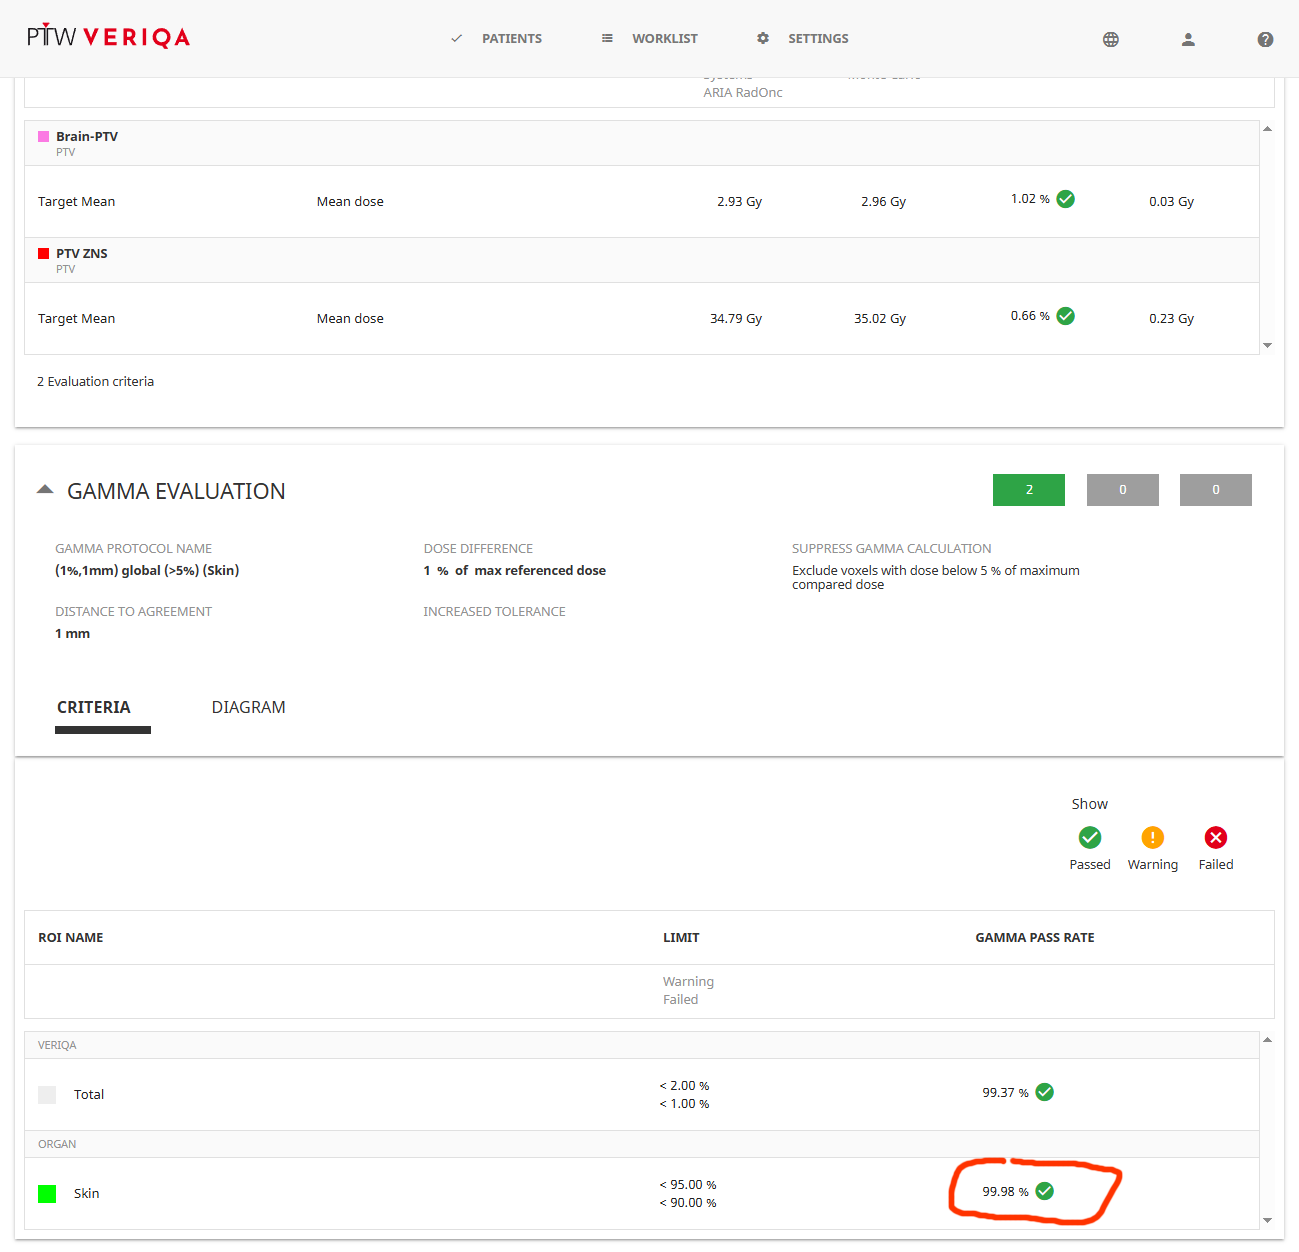
(The Skin structure is relevant here, but the pass rate for the Total volume is not much worse.)
As expected from the high Gamma pass rate, the main color in the 3D Gamma map is green:
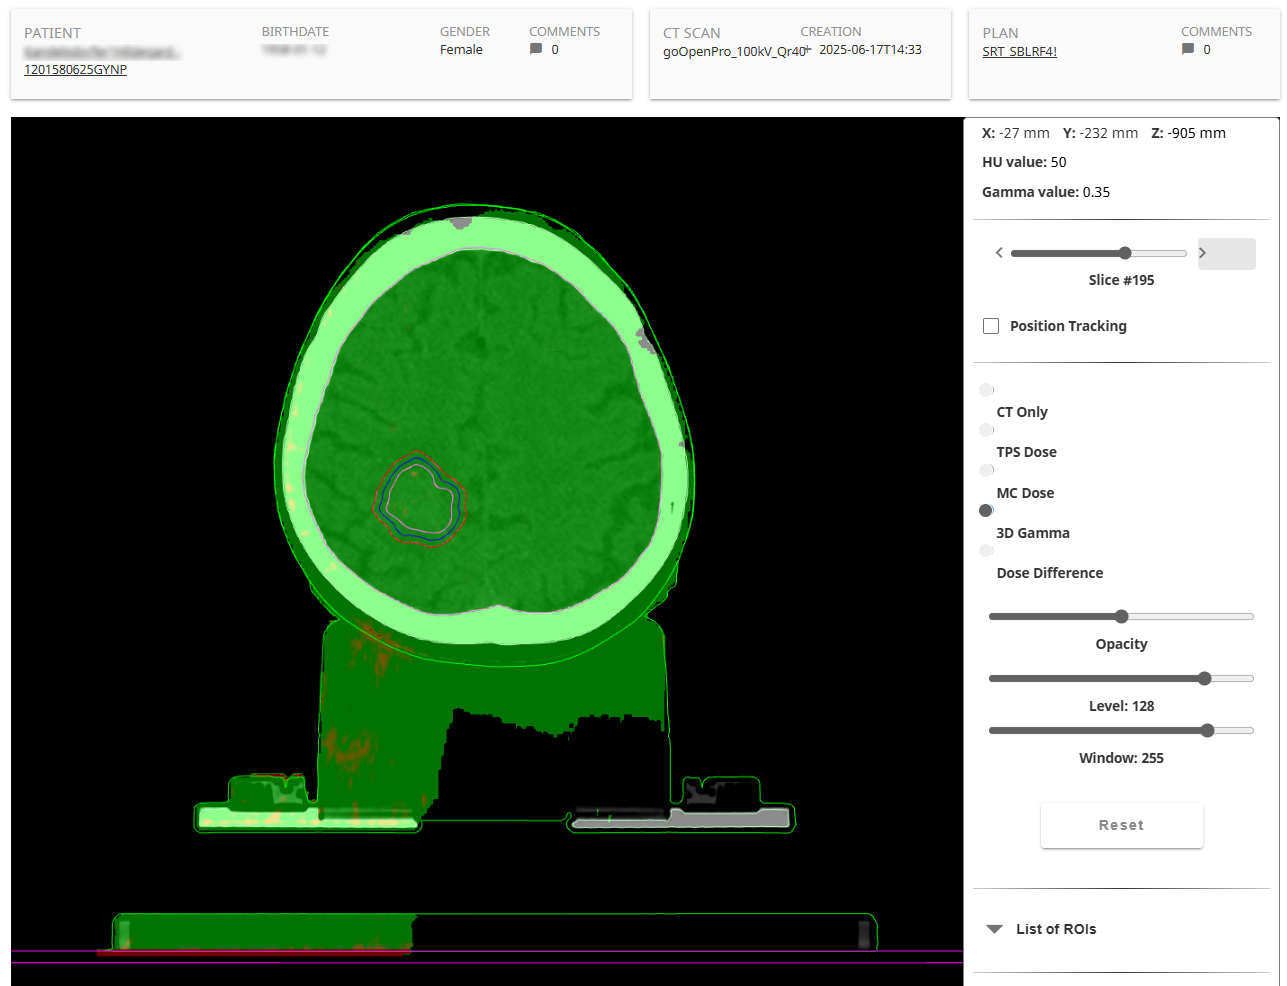
(The 3D Gamma map for 1%/1mm. The BODY and Skin structures are both light green.)
Finally, also the visualization in RT View and the dose profile comparison "works". This is not a given, considering the size of the files (2 MB per CT image, 110 MB for the 3D dose, 39 MB for the Structure Set, in total 736 MB for this plan):
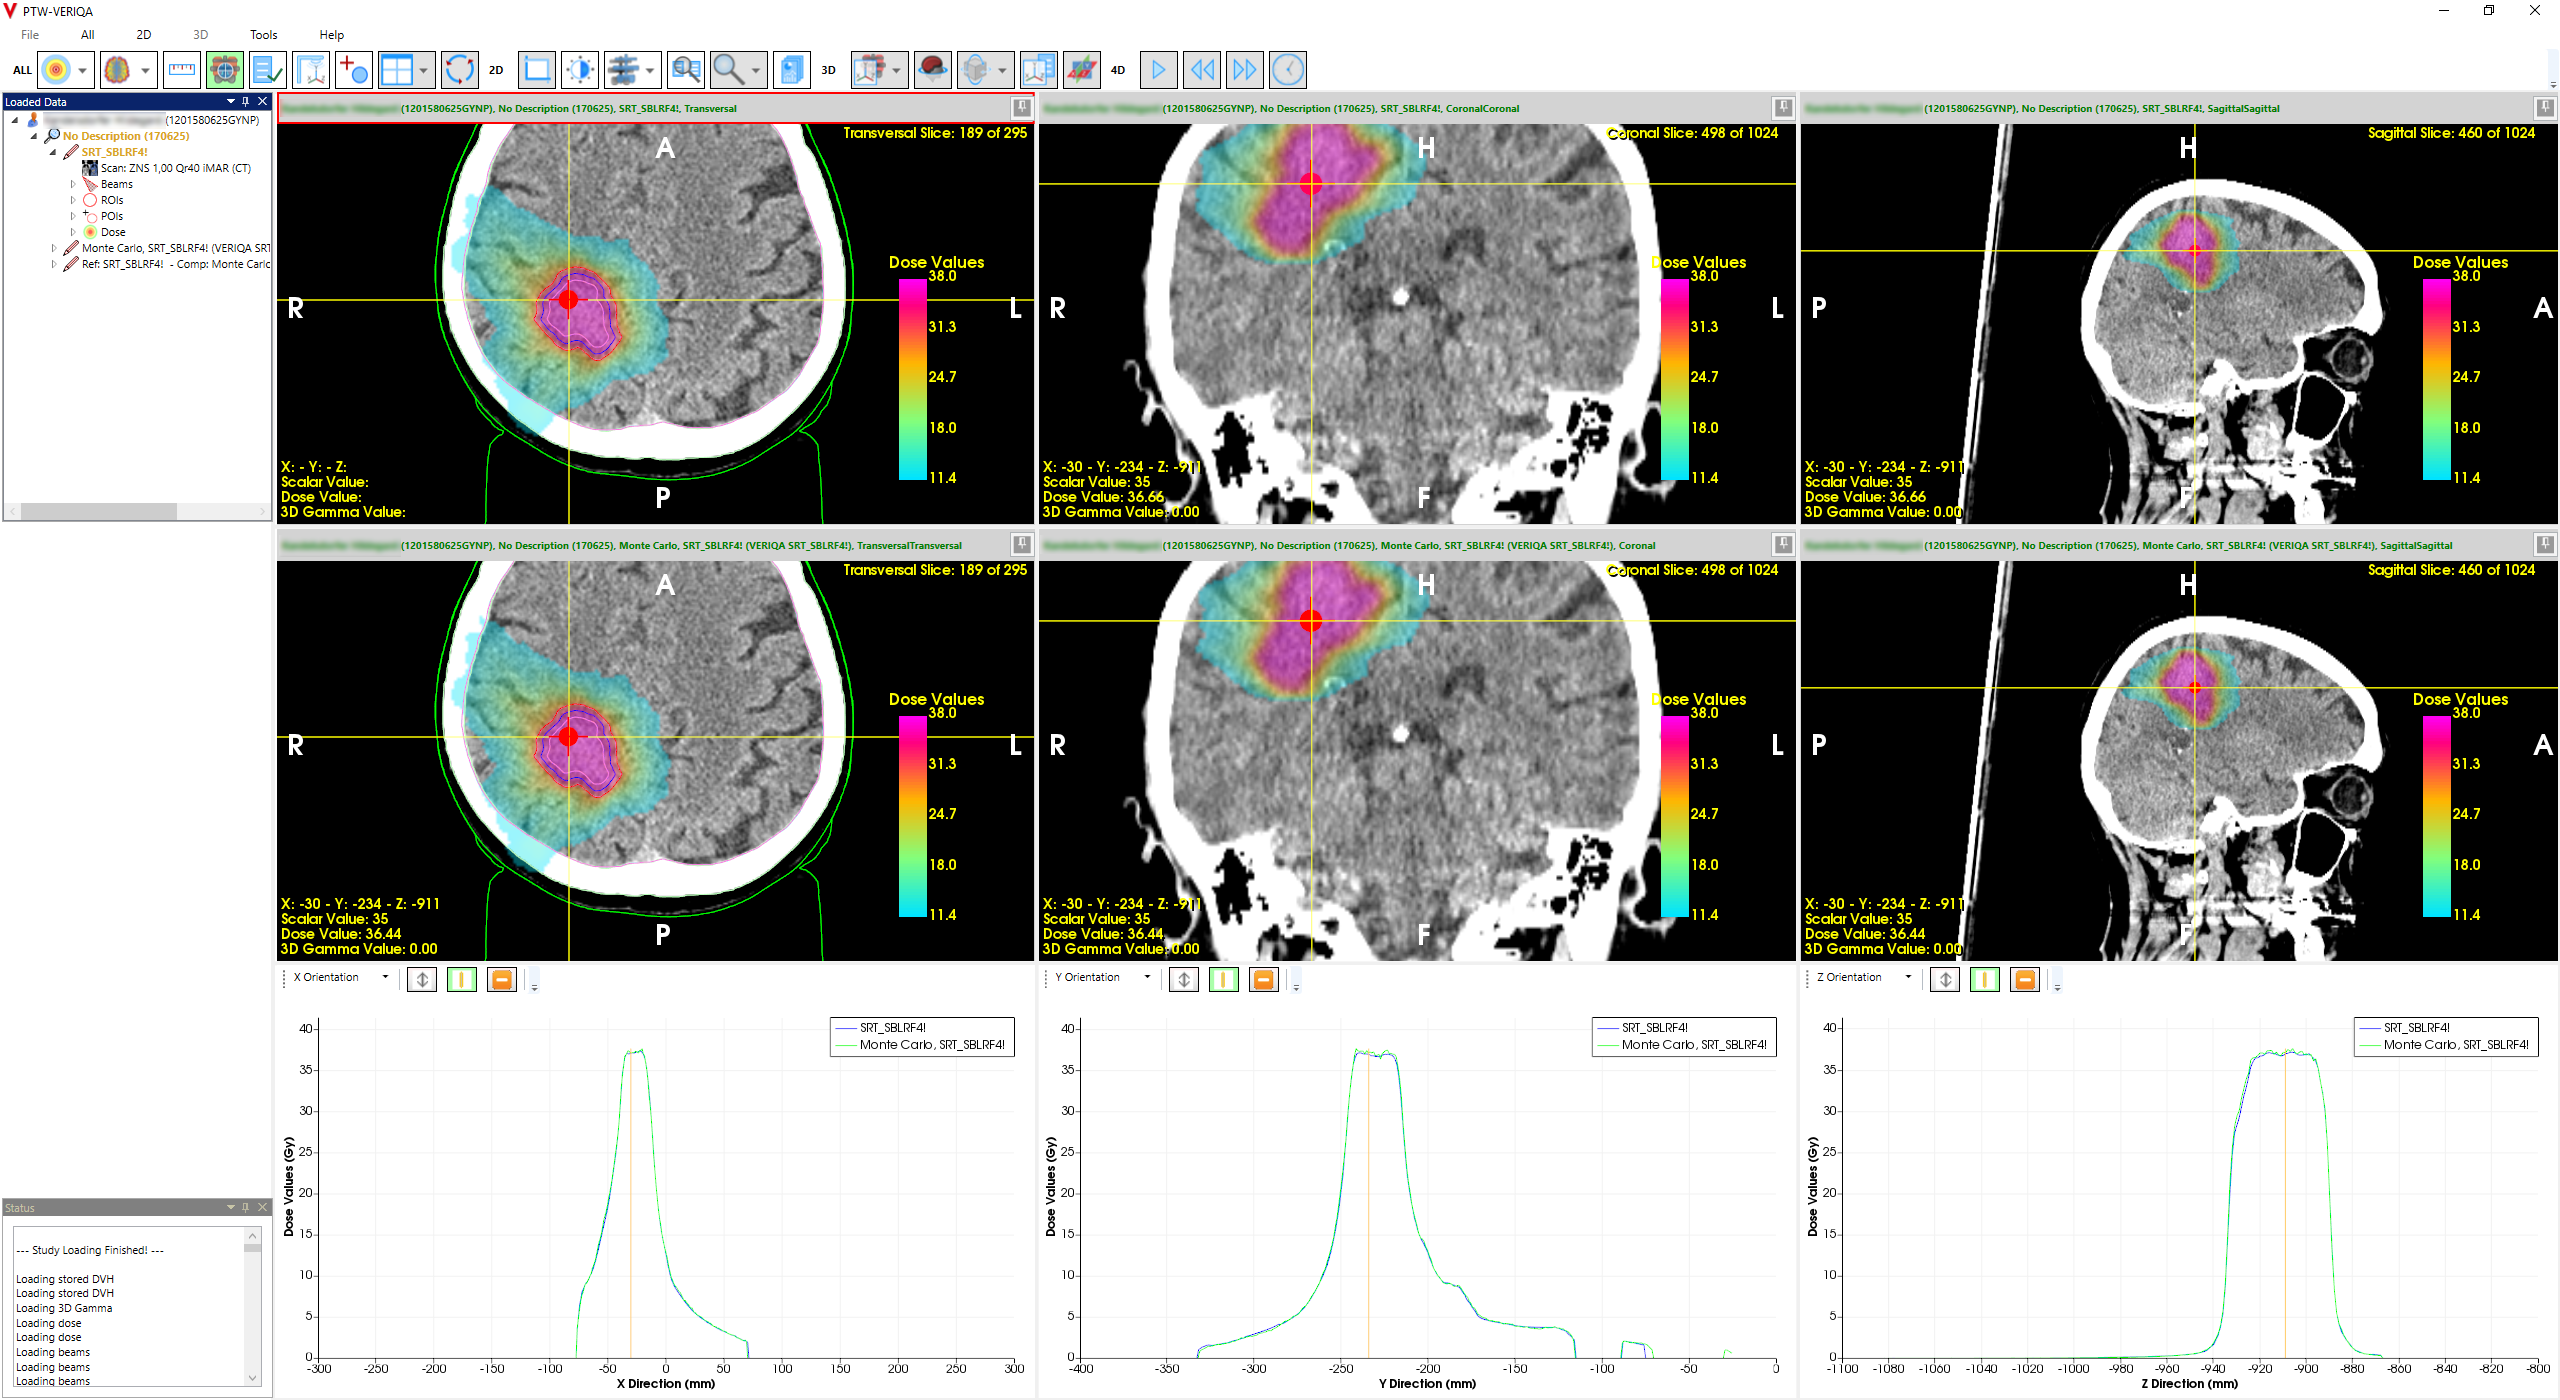
(The visualization in RT View takes a little longer than usual, mainly due to the PM images.)
Conclusion
Even with all parameters set to maximum resolution during imaging and treatment planning, no memory problems could be observed, which answers the above question with "yes". What we actually did not expect was that even the tightest tolerances during dose verification (1%/1mm) could be met, with a passing rate close to 100%.
The package "go.Open Pro + Eclipse (AcurosXB) + VERIQA (SciMoCa)" passed this unusual pre-treatment end-to-end-test with an impressive result.
CARE kV was activated on our go.Open Pro on June 24, 2025.
Notes
1 The time is taken from pressing the "Calculate Volume" button until the dose distribution appears on the screen.
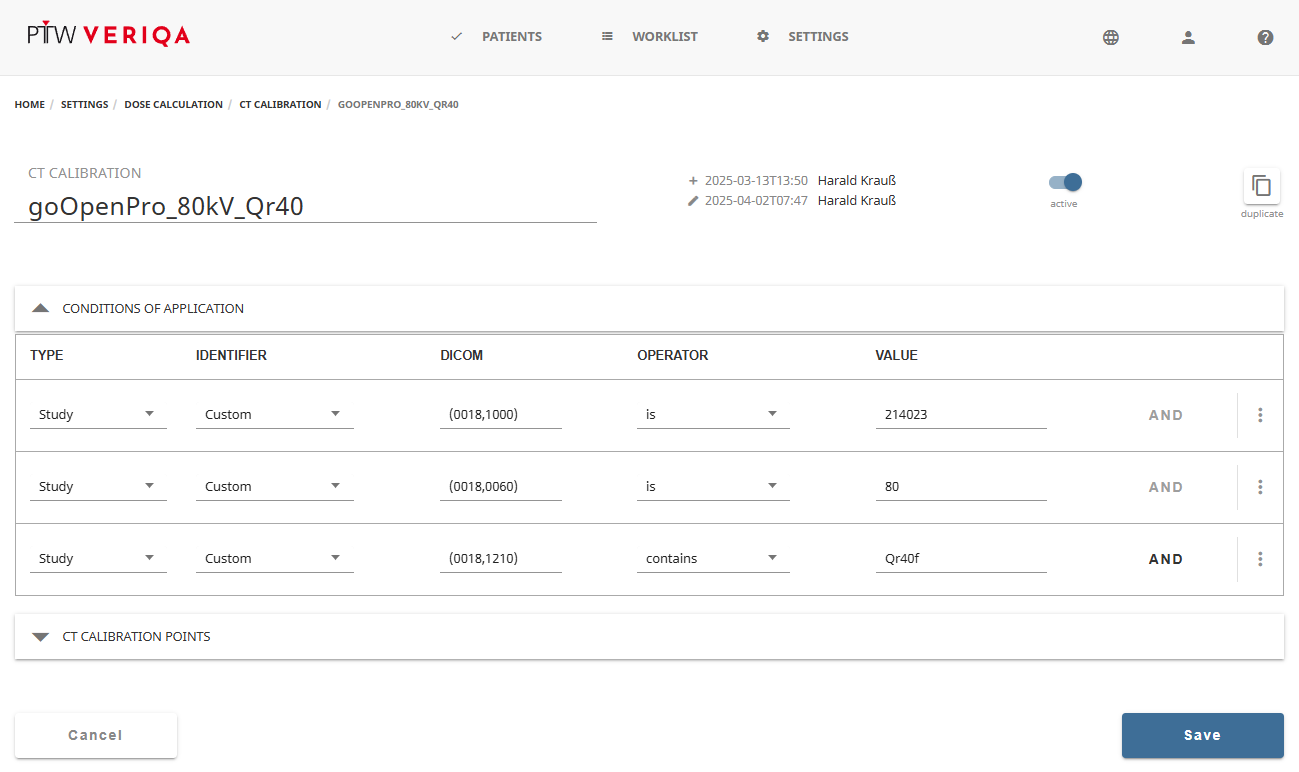
2 If the CT tube voltage can have multiple values, match rules must also be defined in VERIQA. This can be done under Settings > Dose Calculation > CT Calibration (here for 80 kV). And it is clear that the CT Calibration Points should be identical to the TPS.
3 From selecting VERIQA Export ... in Eclipse until the results appear in VERIQA under Recent Plan Evaluations. It takes over 1 minute until the DICOM objects are exported from Eclipse, so the VERIQA time is about 4 minutes.