Treatment Statistics 1997 - 2025
Our Institute started treating patients on December 23, 1996. Since then, the basic configuration - two identical linacs - has remained the same.
In 1996, we started with two Clinacs and a Ximatron simulator1. The Ximatron was later replaced by an AquilionLB CT scanner (which was switched to a goOpen Pro recently). The Clinacs were replaced by TrueBeams. All changes are documented in the blog.
The software evolution is even more impressive. We started with VARiS 1.2 and Vision 1.02. The Vision software from Varian managed all MV-Port images from the Clinacs and the Simulation images from the Ximatron. As early as 1996, the scaled Simulation images were routinely used for matching with the MV port images on the Clinac before the actual treatment started. This also means that we were filmless right from the beginning. The VARiS and Vision products were later merged into a single Oncology Information System (ARIA), which finally also included an integrated TPS (Eclipse).
(Software version numbers are what the user sees. Database numbering is different.)
In 2025, we are close to our 30th anniversary regarding treatments (and to the 25th anniversary regarding modulated treatments), so we want to take the opportunity and extract some statistical data from the ARIA database.
Counting Principles
For such a long period, several aspects have to be considered. First of all, we don't want to get drowned in numbers. We choose a binning of one month for all data. This still adds up to 340 rows between January 19974 and April 2025.
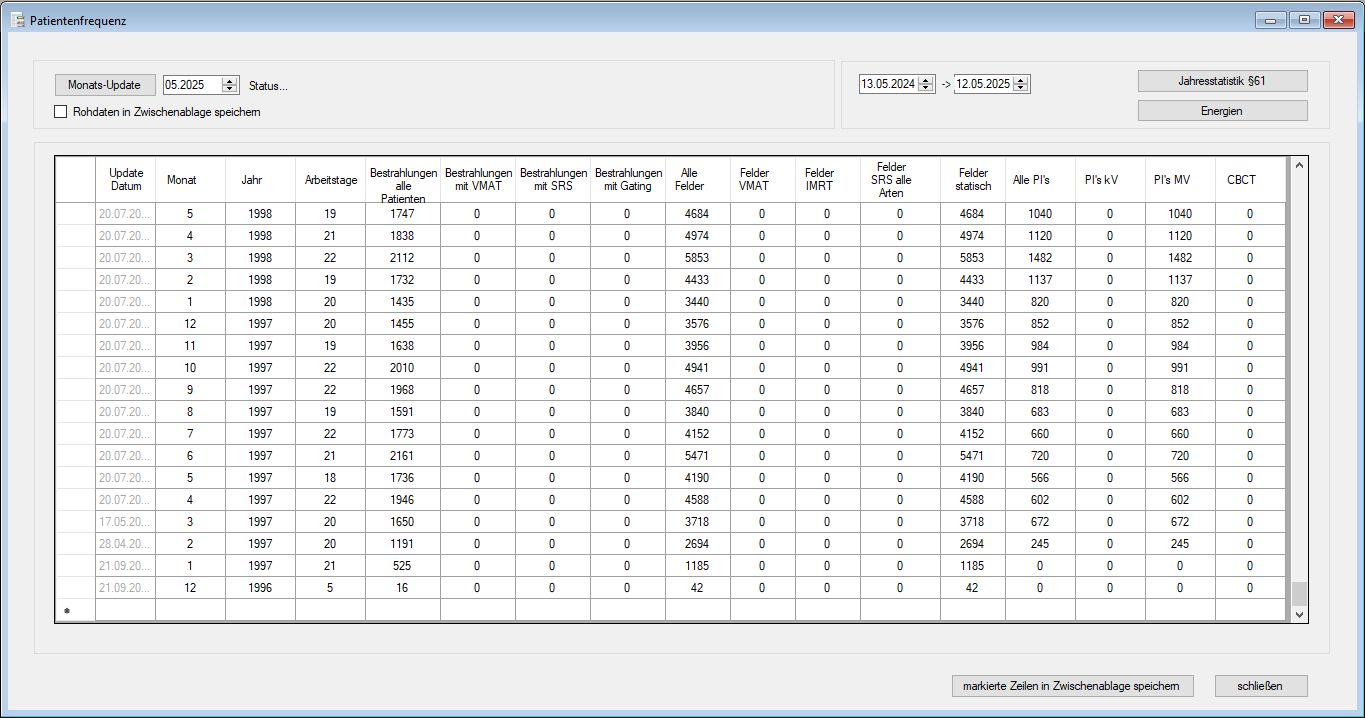
(The early days. Ramp-up happened quickly in 1997. All data are for two machines.)
The front end of the database queries, which can be invoked from the Statistics menu of our home-made ICODES software, is a routine Michael programmed decades ago and which still runs perfectly. In 2012, it was adapted to include the new features of the TrueBeam (VMAT, CBCT, Gating etc.). In Clinac times, the only extra features were MV port images and IMRT.
All the following plots are based on the table shown above. Let's go through the column heads quickly.
- Date of Update (greyed out): whenever the upper left button ("Monats-Update") is pressed, the month next to it (May 2025 in the screenshot) is evaluated and added as top row. The date of the update is important if it lies within the evaluated month: in this case, data is incomplete. It is always a good idea to evaluate months that are complete.
- Month, Year: should be clear.
- Working Days: we only treat patients on working days (Monday through Friday), if it is not a holiday. In this column, we count the true working days of the month, when treatments are performed. The number is required to compute e.g., treatments per day, fields per day etc.
- Treatments All Patients: this is a key figure for the department, therefore it deserves some explanation. The number counts the treatments during one month. What does this mean? If the therapists make a checkmark every time they see a patient coming out of the vault after he was treated, the total number of checkmarks for both machines by the end of the month is displayed here. This also means that if the patient has three treatments of three different body regions in a single session (this can happen for palliative patients), this counts as one treatment, not three. One could also say we count appointments, not treated plans.
- VMAT Treatments: while Treatment All Patients does not distinguish between techniques, the VMAT Treatments count treatments where at least one treatment field is of type "Arc Therapy".
- SRS Treatments: for practical reasons, we avoid the question "What is a stereotactic treatment?" Instead, we use the Varian definition: if the Technique is either SRS Static or SRS Arc, we count it as SRS. Eclipse requires the user to select the SRS techniques whenever the MU per field are over a certain limit (e.g., 1500 MU for VMAT). For a palliative VMAT bone treatment of 1 x 8 Gy and 2500 MU, the user must select SRS Arc, although strictly speaking, due to the large field size, the plan would normally not be considered as being "stereotactic". On the other hand, a "true" small-field stereotactic lung case with three 6FFF arcs and Gating could be missed in the SRS statistics if the MU numbers are below 1500 and the user forgot to set the technique to SRS Arc (not being required to). HyperArc always uses the "SRS Arc Therapy" technique in combination with the Setup "HyperArc". Normal VMAT and SRS Arc treatments use "Isocentric" as Setup.
- Treatments with Gating: whenever the "Use Gating" flag is set in the Properties of a plan, the treatment is counted here.
- The next five columns look at the Field level. The Field is a rather clearly defined entity. It is moded up on the machine with settings for MU, energy, technique etc. VMAT arcs are just another type of "Field". All Fields does what it says: it counts all treatment fields treated on our two machines.
- The VMAT Fields, IMRT Fields, SRS Fields (All Types) and Static Fields have the property that they always add up to the previous All Fields number: VMAT + IMRT + Static + SRS = All. It seems a little strange to count that way, since SRS can be either Static or Arc. However, counting the same field twice is avoided, and this is the most important principle.
- "All PI's" is the sum of all (planar) kV images (not CBCT) and all MV images, no matter whether they are acquired "Before", "During", or "After" the treatment field. "Integrated" aka "Dosimetric" images are also counted here.)
- CBCT images are the volumetric images (acquisitions), not the formatted 2D slices.
Treatment Statistics
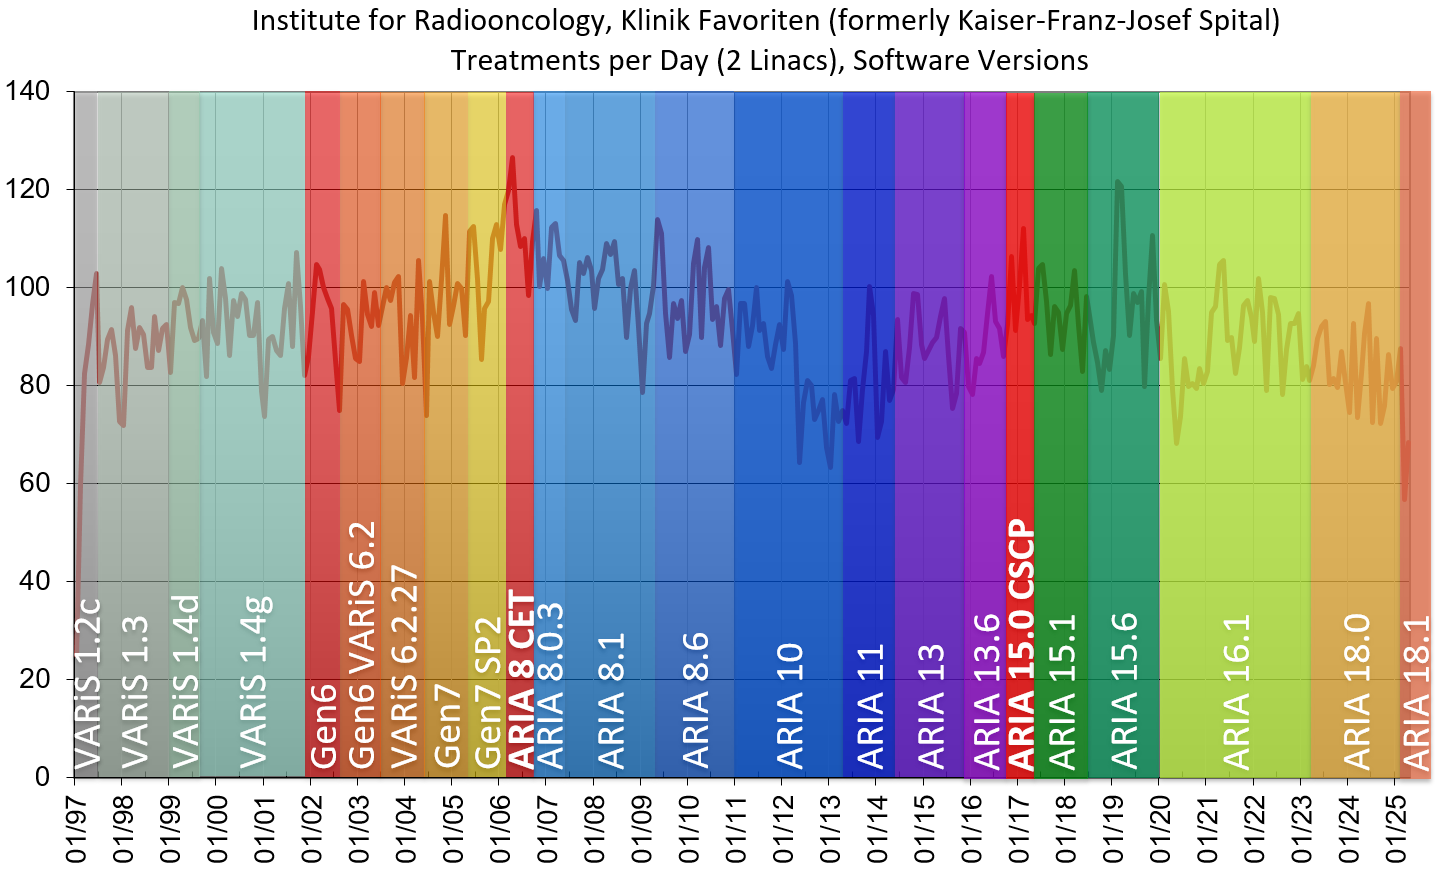
The number of treatments per day is computed by dividing the Treatments All Patients by the number of working days. Remember that each data point stands for one month, so it is a monthly average:

The all time high (126.5 treatments/day in April 2006) was interestingly reached during the so-called Customer Evaluation Testing (CET) of ARIA, the first installation worldwide5. For a brand new product, one usually expects more bugs and glitches than "usual", which can have some negative impact on overall performance (besides the extra workload for the department caused by the reporting duties during the testing). But it looks like this very first version of the ARIA software was good enough to make this "record" possible.
The transition from Clinac to TrueBeam in 2012/13 is visible in the data, but it is not dramatic. Missing treatments due to one machine at a time being down were largely compensated by extending the treatment hours to 10 p.m., sometimes beyond, over a period of two years.
The most recent ditch in the curve (March 2025) stems from the CT replacement. While the room was prepared and the goOpen Pro installed, we used for treatment planning the CT from the Radiology department. Due to restricted time slots and capabilities of the scanner (no Laser System for VSIM, no RGSC, no 4D-CT etc.), numbers went down, some even to zero (DIBH treatments).
The date of retirement of our long-term Chief Radiooncologist, Dr. Schratter, is also indicated in the plot.
The next table shows the most recent data (including April 2025). A single gated treatment was logged in March 2025. Looking into the raw data revealed that this actually had been a test patient, treated on the weekend of the ARIA 18.1 upgrade:
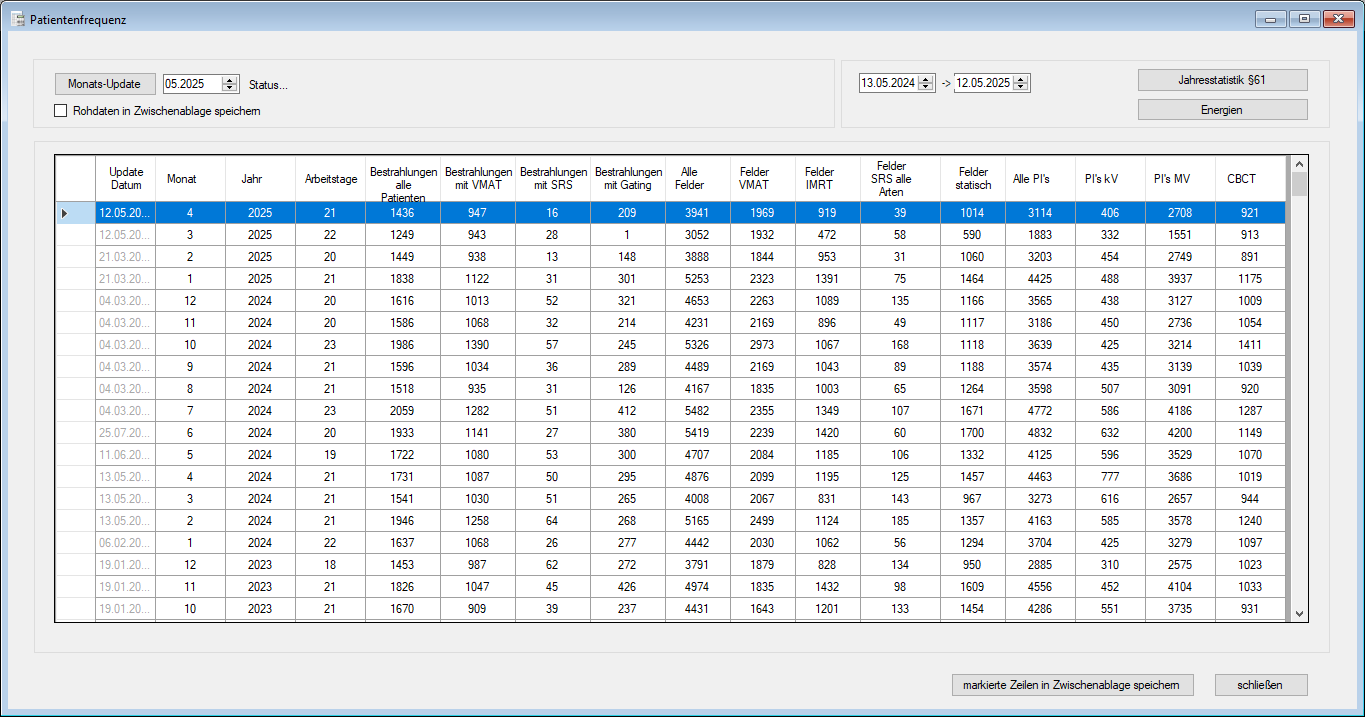
(The recent past. In March 2025, many advanced techniques such as Gating had to be postponed.)
Regarding imaging, one can see that all modalities (kV, MV, CBCT) are heavily used. The number of CBCT images acquired on both machines (last column) is typically over 1000 per month, or 50 per day.
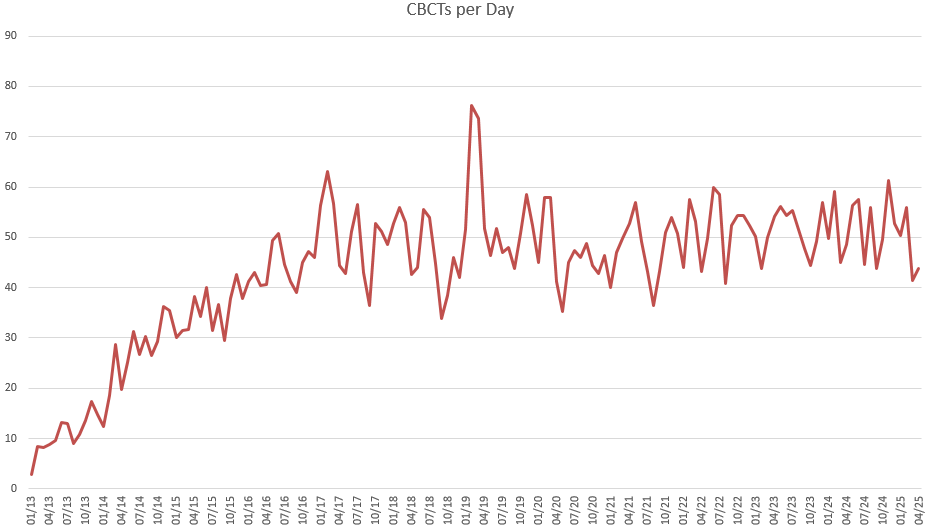
(CBCTs acquired per day on both machines. X-axis starts in 2013, because the Clinacs had no CBCT.)
The number of treatment fields per day can be plotted over the full period. Here, a clear transition can be seen when we switched from Clinac to TrueBeam:
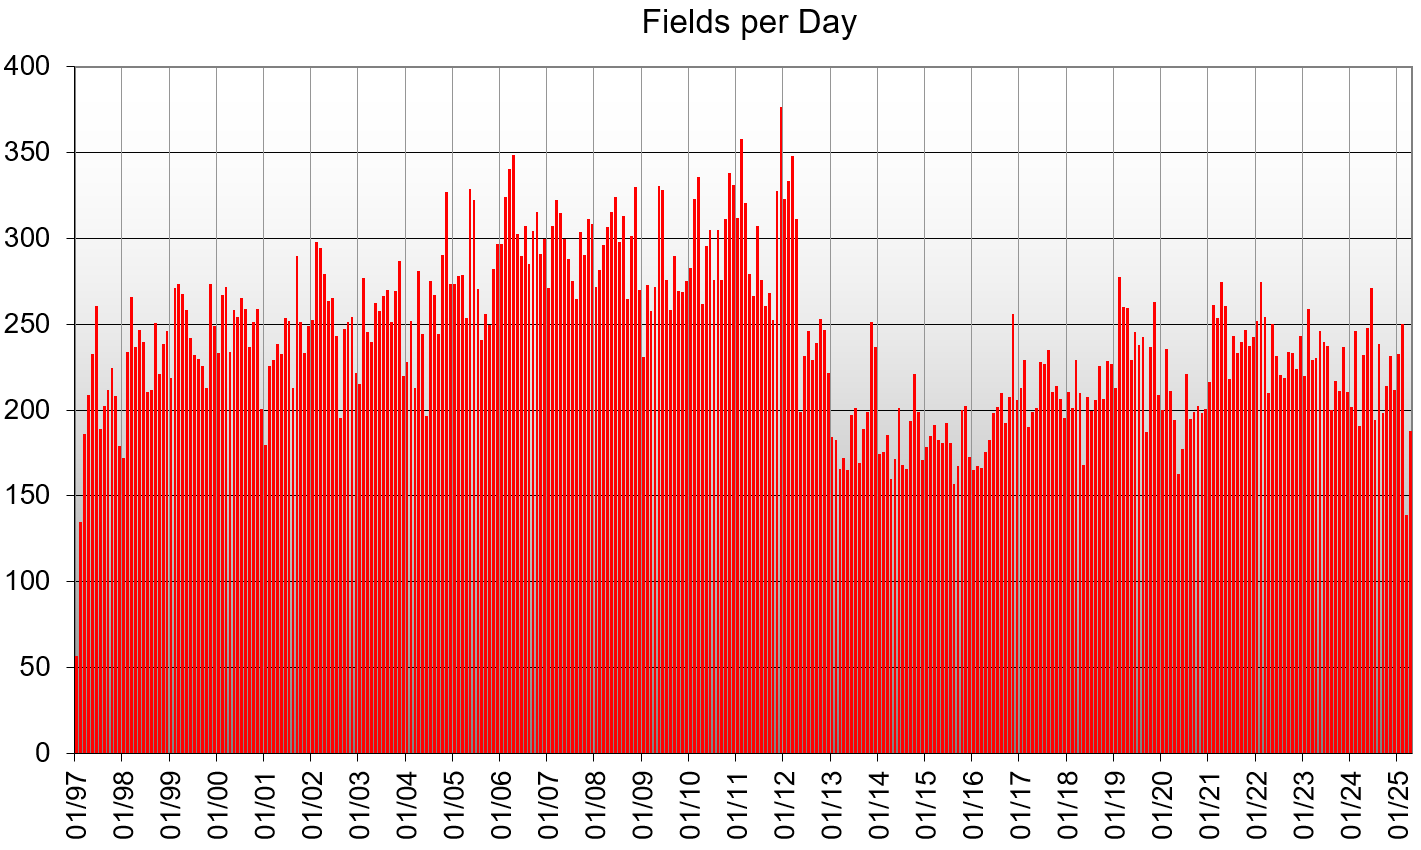
In the Clinac era, the field counter was biased by multi-field IMRT plans (e.g., head & neck, prostate). Most of these fields were replaced by one or two arcs on the TrueBeams. This explains the drop in 2013.
In the first three years of TrueBeam use (2013 - 2015), we were obviously focussing on the new VMAT technique. By implementing the Hybrid-IMRT-Technique6, IMRT in the context of breast found its place again7 in 2016, which resulted in a sharp increase of IMRT fields (blue curve). Since several years, the Static and IMRT curves move in synchrony:
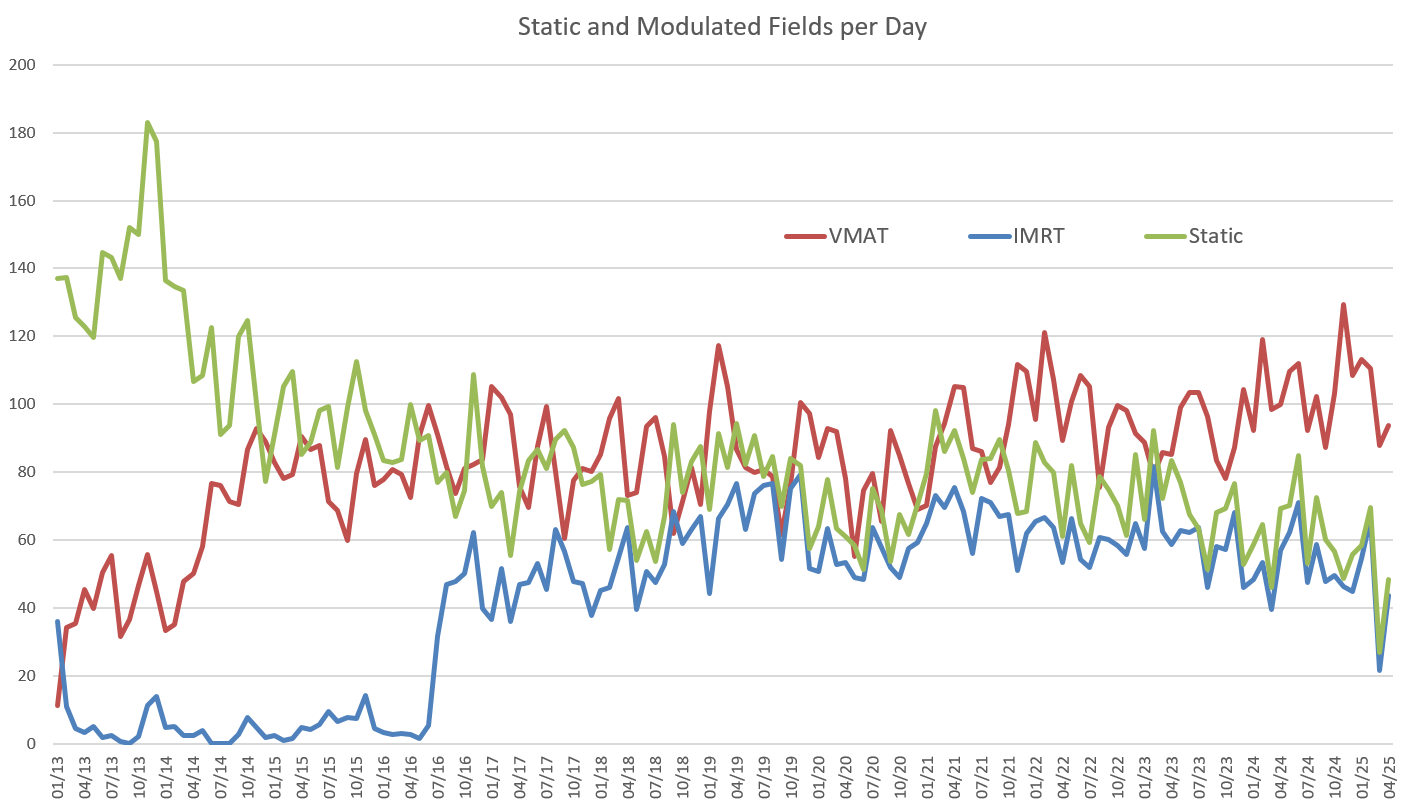
(On the "Field" level, each treated field is counted separately, no matter to which plan it belongs.)
The graph counts each field separately, no matter how the fields are grouped into plans. If we want to answer questions such as "How many VMAT treatments?" or "How many IMRT treatments?", we have to do two things:
- Group the treated fields which belong together, i.e. which are part of the same plan.
- Classify the treated plan either as "Static", "IMRT", or "VMAT".
Many treatments such as Hybrid-IMRT use a mixture of techniques in the same plan. Sometimes our breast plans even contain an additional VMAT arc, which adds a Simultaneously Integrated Boost (SIB) dose to the treated volume. This arc typically runs between the two tangential Gantry angles. Such a plan technically contains Static, IMRT and VMAT fields. How should we classify it?
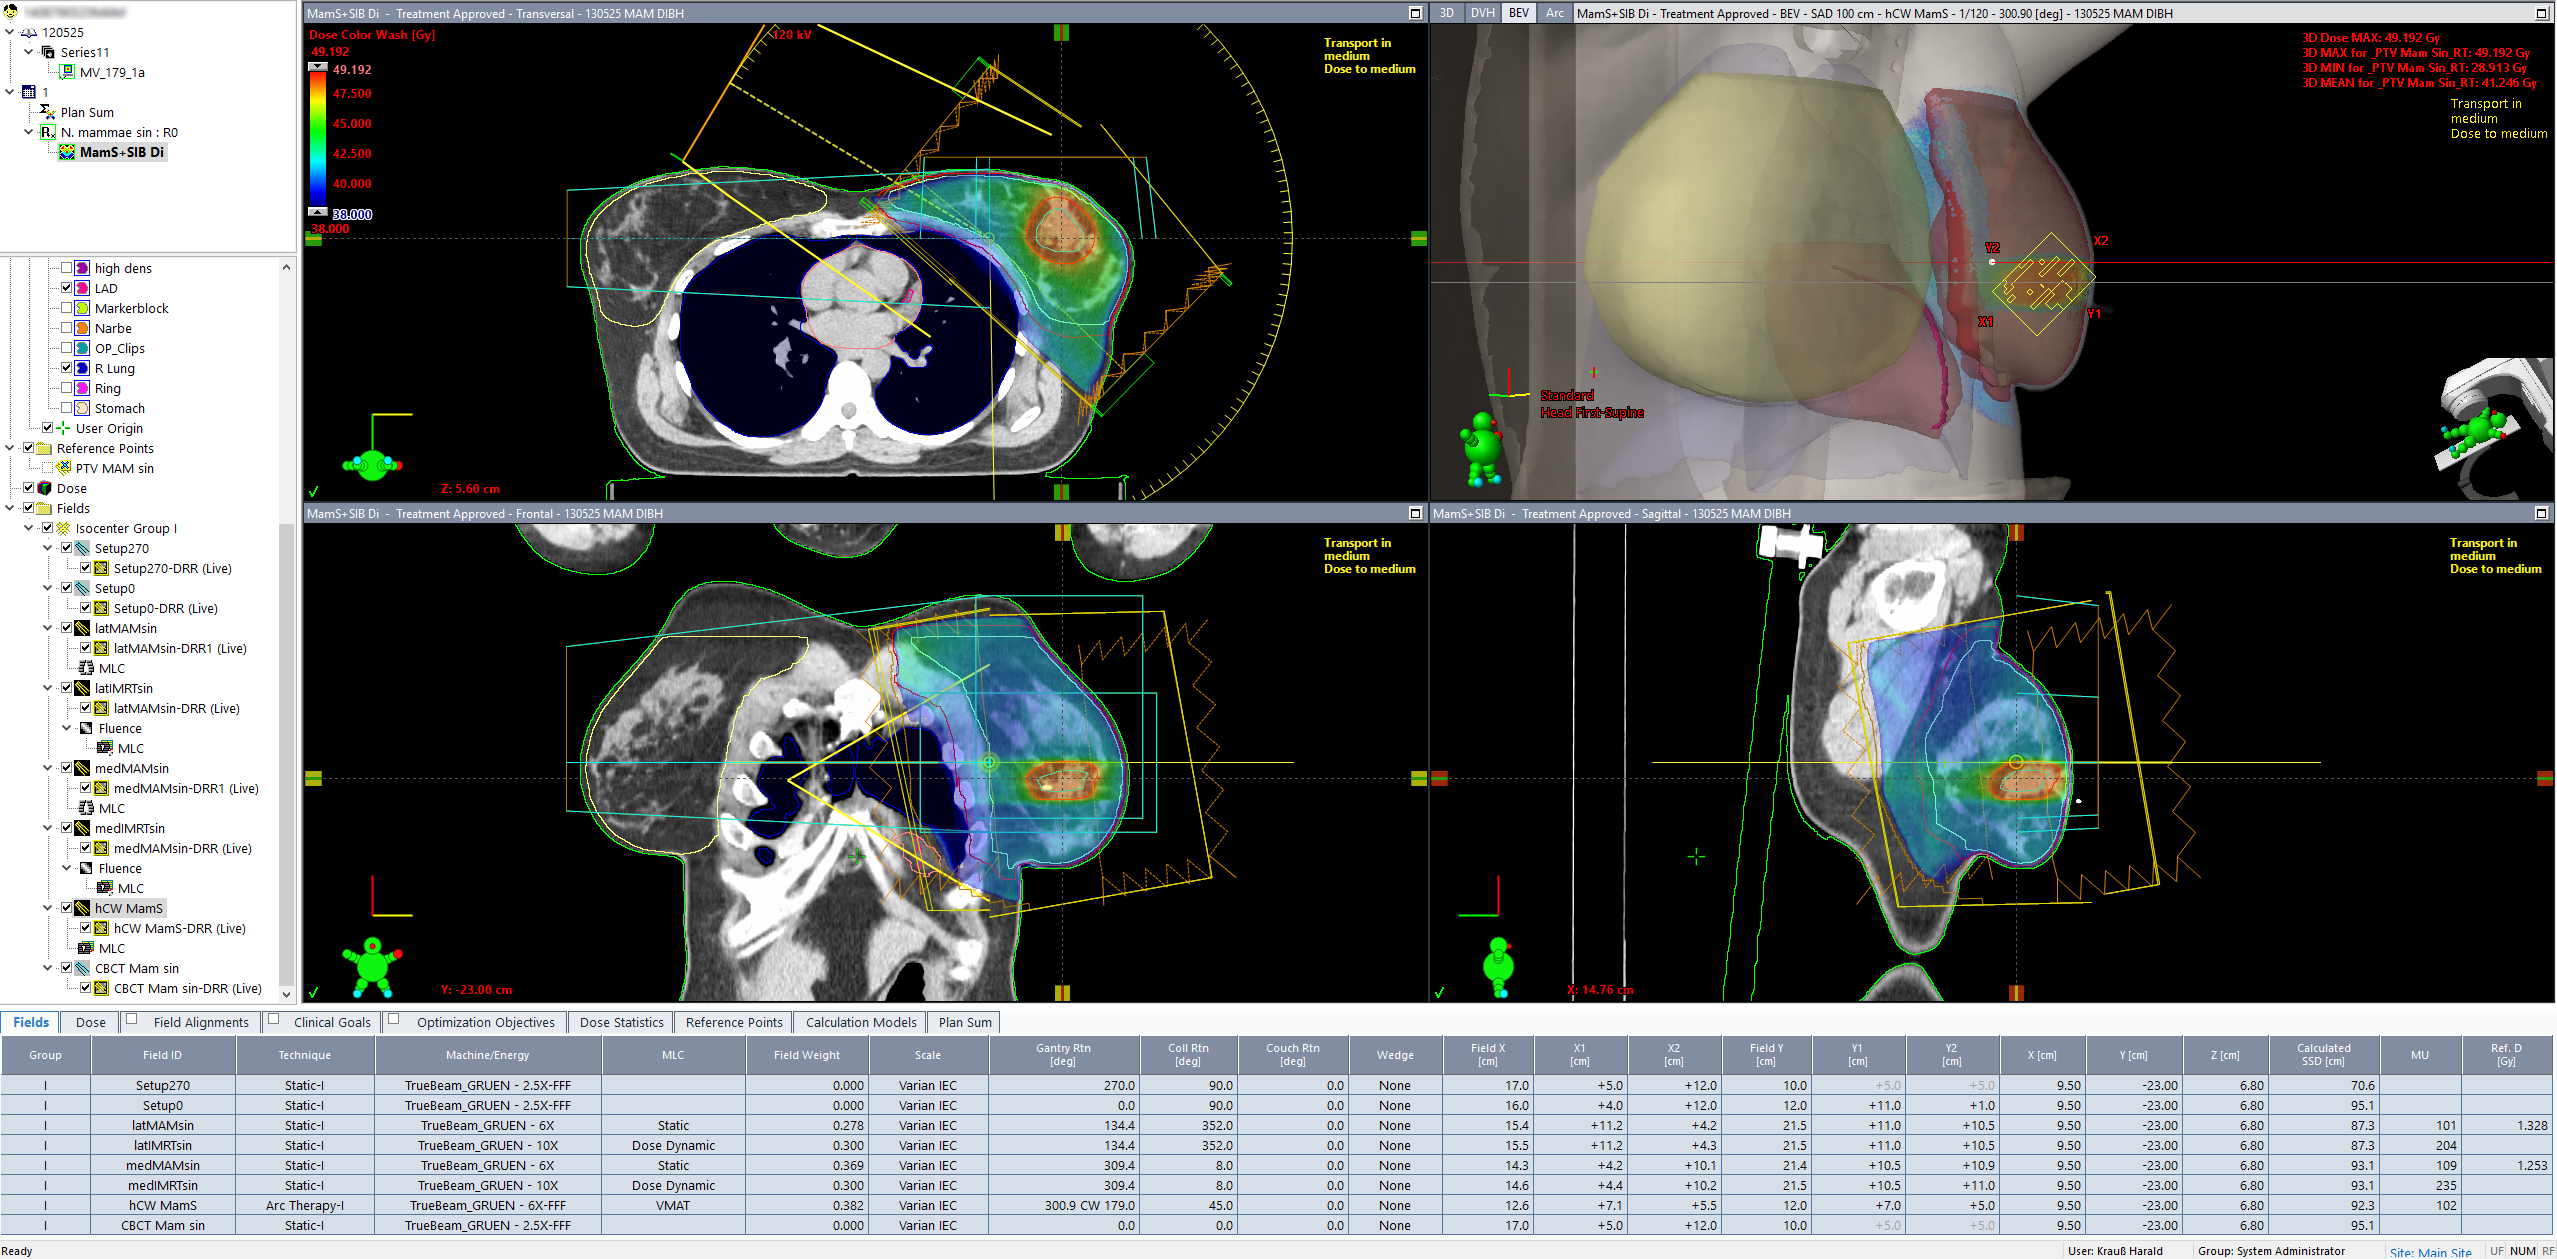
(Left breast treated with DIBH to 40.05 Gy, SIB volume to 48 Gy. The plan uses static, IMRT and VMAT fields.)
One principle could be that the "most advanced" technique wins. Following this principle, The "Hybrid-IMRT+SIB"-plan would be recorded as VMAT plan, because VMAT is the most advanced technique in the plan. This avoids double or even triple counting of the same treatment.
If we classify all treatments accordingly and plot the percentage of each type (Static + IMRT + VMAT = 100%), we get the following (the x-axis again starts in 1997):
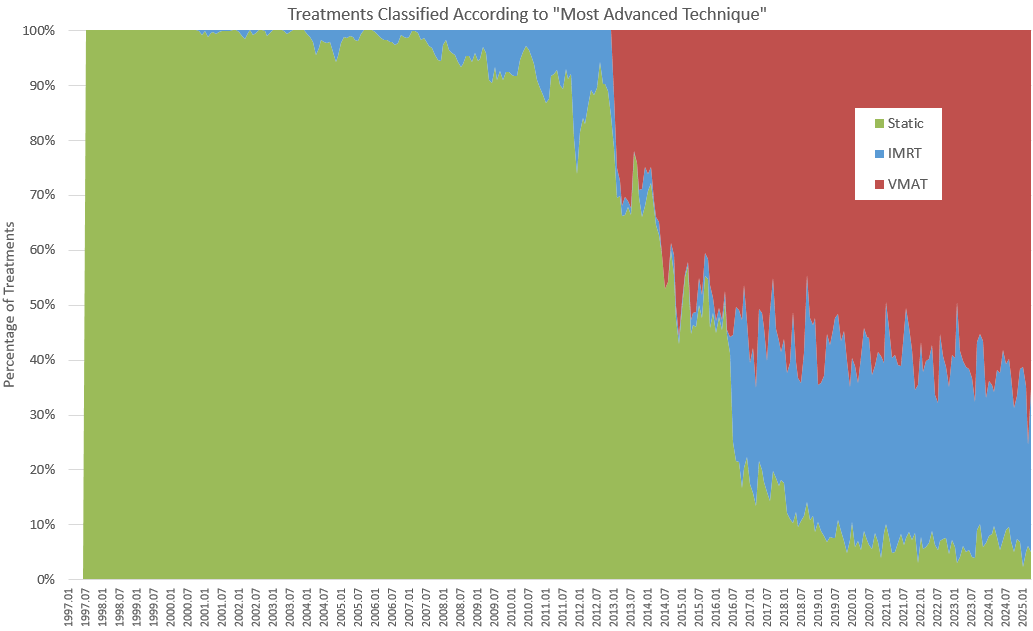
The IMRT treatments started in Dec 2000, and this is where the blue area slowly starts to grow. One can also see that in the transition era (2013 - 2015), only very few IMRT treatments were performed.
Due to the classification rule, and because most of the static fields since 2016 are part of a Hybrid-IMRT plan, the fraction of "Static" plans in recent years is much lower than the number of "Static" fields in the "Static and Modulated Fields per Day"-plot. Remember that we have switched from the (treated) "Field" view to the (treated) "Plan" view: The IMRT field "wins", and the plan counts as "IMRT".
There are only a few treatments at our Institute which are truly Static: most benign Photon treatments (e.g., heel spur, 6 x 0.5 Gy), and all Electron fields.
If we group the treatments according to VMAT + IMRT = Modulated and relate this number to the total number of treatments, we can easily compute a modulation degree in %. It turns out that since 2019, only about 5% of all treatments are not modulated:
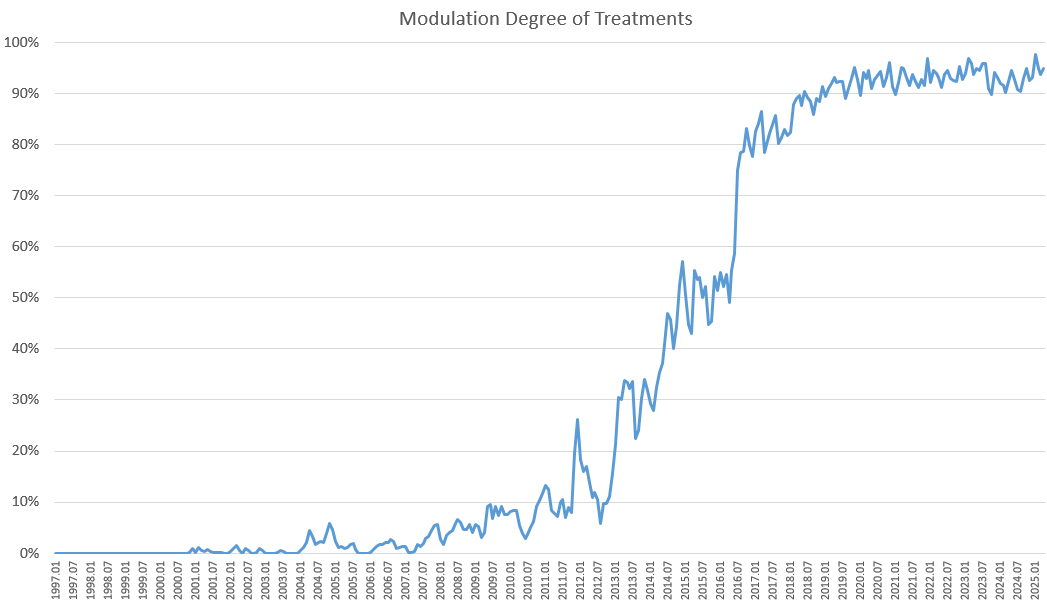
(On the TrueBeams, the percentage of modulated treatments has reached saturation in 2019.)
Discussion
In this study, we counted the treatments, not the plans. Our view reflects the workload on the treatment machines, not the "TPS department" (the "dose planners"). On the TPS side, if we generate a typical VMAT Prostate plan, we are good to go for seven weeks8. If we fill our Appointment Scheduling instead with patients where for each patient we have to generate a 1 x 8 Gy VMAT Bone plan, TPS workload is much higher because the plan gets treated only once. Regarding TPS workload, all we can say is that with our configuration (eight Eclipse workstations with GPU), we have not encountered any bottlenecks on the TPS side so far.
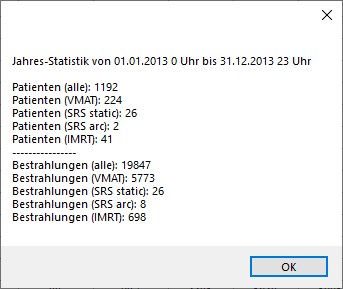
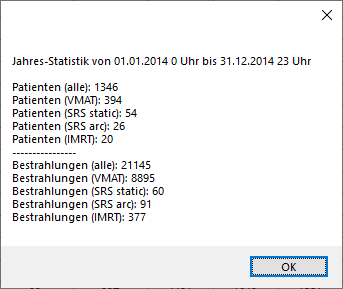
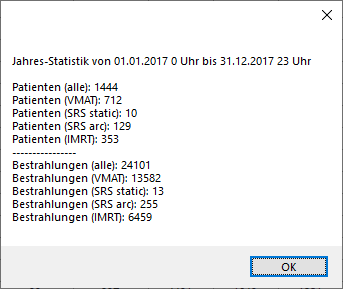
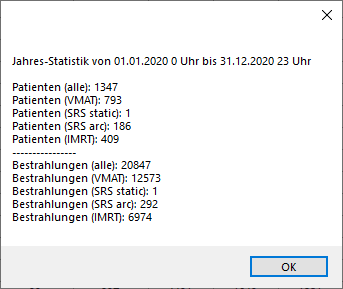
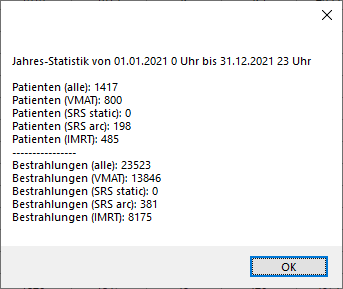
Care must be taken when interpreting the monthly statistics regarding patients per year. From the data shown, the number of patients treated per year in our Institute cannot be extracted. It would reqiure additional information (regarding fractionation etc.). However, we know from other database queries that the total number of patients9 treated on our two machines has always been around 1300 - 1400 per year. See the detailed numbers for 2013, 2014, 2015, 2016, 2017, 2018, 2019, 2020, 2021, 2022, 2023, 2024.
The data shown is proof of the fact that the Varian environment (ARIA software plus treatment machines) is ideally suited for high patient loads and high quality of care. Both can be provided at the same time, over decades.
Notes
1 Due to its CT Option, the Ximatron Simulator could also be used for treatment planning. After a Pre-Collimator had been inserted in the Simulator head and a Post-Collimator in front of the image intensifier, a CT slice could be acquired with a full Gantry rotation, which took about a minute per slice. For Breast planning, we acquired five slices with 5 cm slice spacing.
2 Actually the first installed version ot the Vision software was still "beta".
3 First IMRT treatment was on Dec 4, 2000.
4 In the following plots, we will always omit the five working days in December 1996 (16 treatments, 42 fields).
5 This is also the reason why our ARIA serial number is still HIT0002 (HIT0001 never existed).
6 A typical breast plan consists of two static and two IMRT fields.
7 In the Clinac era, breast treatments were often based on the ISC technique. Coincidentally, the 1st patient treated on the TrueBeam on Jan 2, 2013 was also an ISC patient.
8 Assuming there are no rescans/replannings.
9 Again, additional definitions have to be made. What is a "patient"? If, for instance, a patient receives a palliative treatment of 10 x 3 Gy in March, then shows up again in September to get a 1 x 8 Gy treatment, we count him as two patients, not one. One could say we are rather counting Courses.