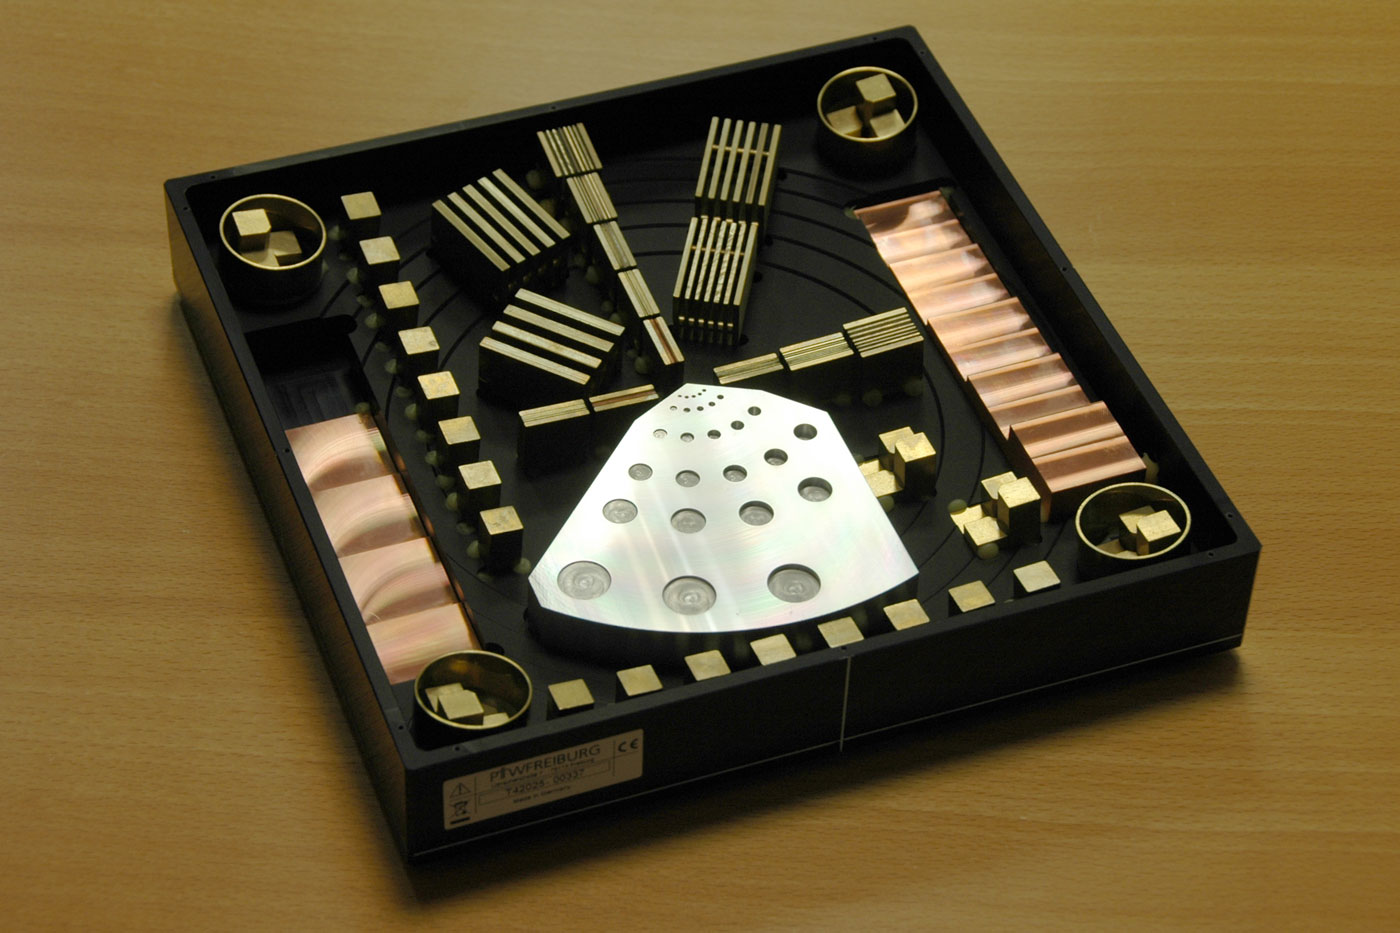
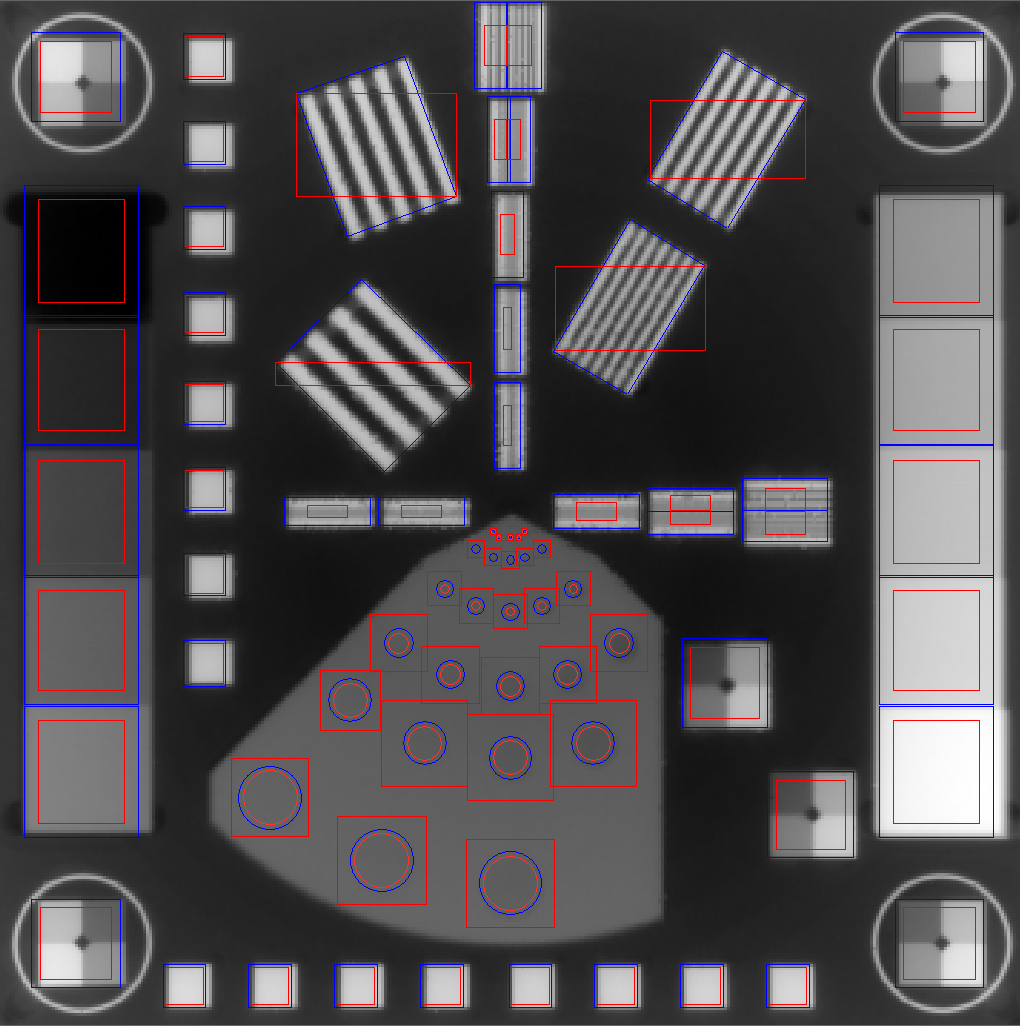
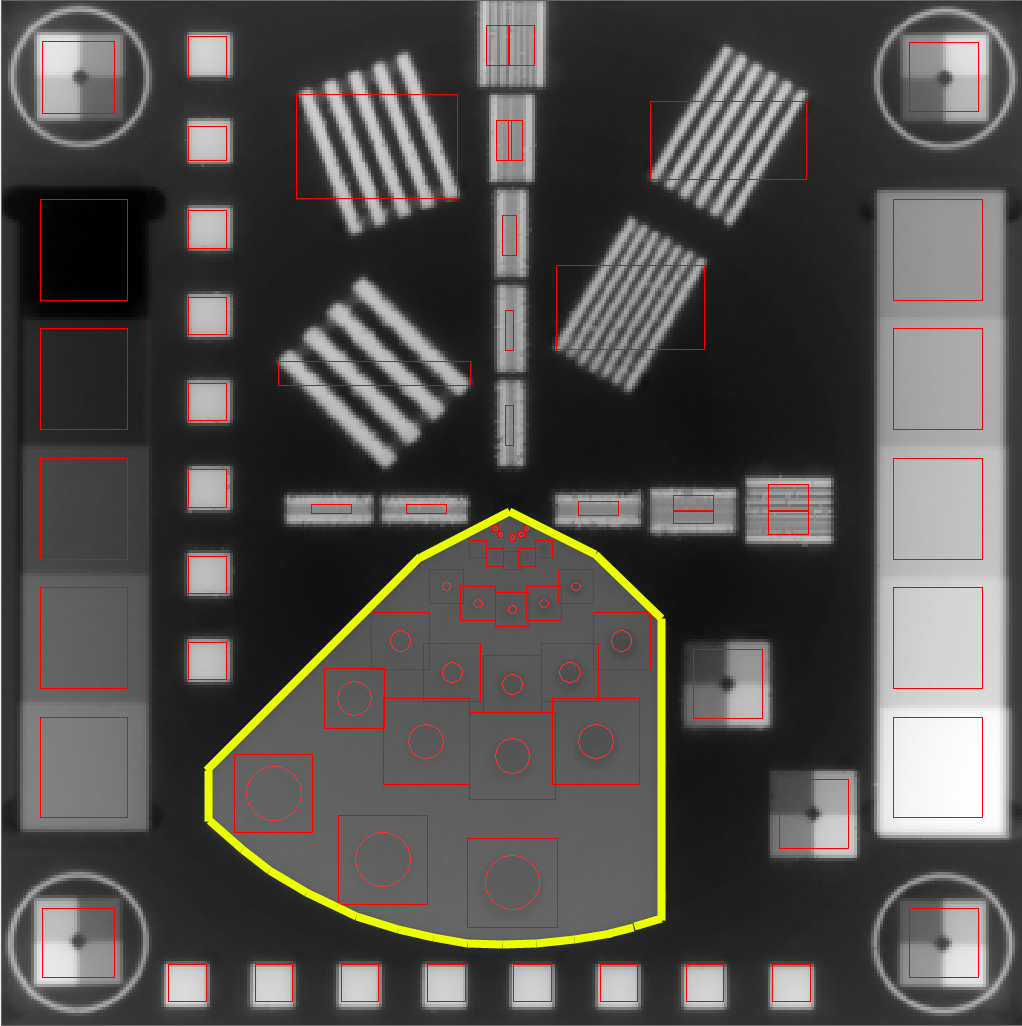
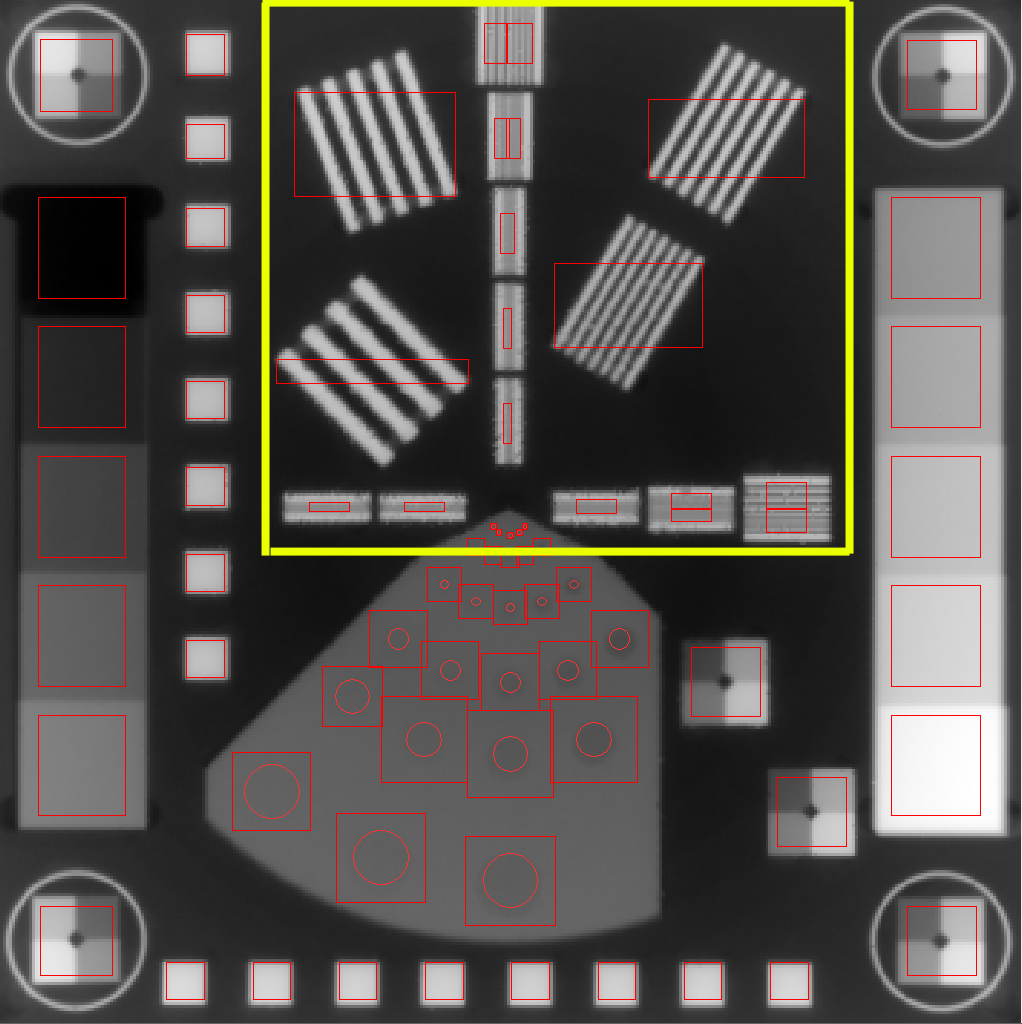
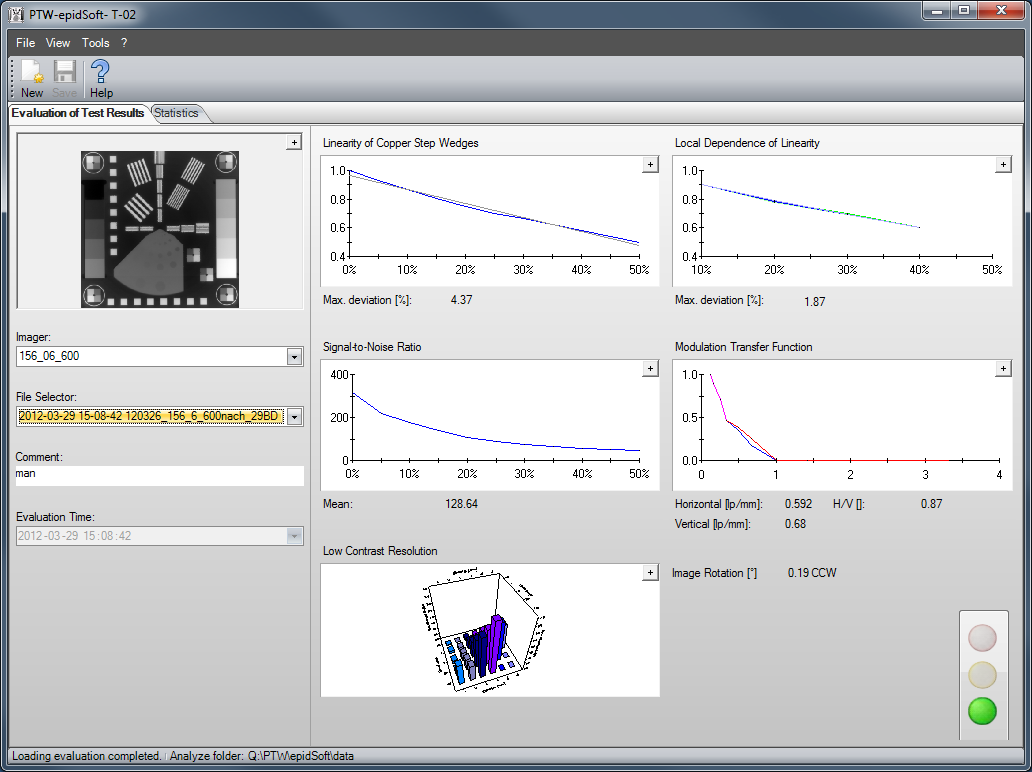
The core task of EPID QA is typically the imaging of a special phantom which contains an assembly of different test modules (for linearity, signal-to-noise ratio, MTF etc., see Fig. 1 in the sidebar). Dedicated software is then used to evaluate the images by performing image analysis tasks in the image regions of the modules.
The first step in the image evaluation process is usually the import and registration of the acquired EPID images. For the test subroutines to work correctly, the image has to be aligned so that the locations of the modules in the image correspond to the expected positions (where the analysis operations will later be performed). This is either achieved by an automatic registration routine which rotates and shifts the image to the desired position (after using edge detection, Hough transforms and other algorithms), or by a manual alignment which is performed by the user.
A good automatic registration algorithm must be fast, stable and accurate (at least as accurate as the best manual alignment).
Material and Methods
We tested the registration algorithm of the PTW's EPID QA combination, which consists of the EPID QC PHANTOM (Fig. 1) and the epidSoft software:
Current epidSoft version is 2.2 (we also tested version 2.3-T02, which contains a minor modification related to Varian EPID images).
Our Clinacs (2300C/D) are equipped with IDU20 image detection units. These are capable of producing 1024 x 768 px images. However, since the old IAS2 image acquisition system are still in use on the Clinacs, image pixels are combined so that the actual output image size is always 512 x 384 px (aS500).
Before epidSoft can be used, at least one "Imager" (epidSoft terminology) has to be defined. Since on our linacs the image acquisition modes for different combinations of energy, dose rate and type (single image or integrating)1 are calibrated separately, it makes sense to use the combination "machine serial + energy + dose rate" as one Imager in epidSoft, e.g. 156_6_600. We do not have to add another tag for the integrating images, since they are always acquired with 300 MU/min, whereas single images use dose rates of 100 (port mode) or 600 (during images) MU/min.
For the current task, we analysed 22 images from Imager 156_6_100 and 24 images from 156_6_600, which were acquired on Clinac 156 between Oct 2010 and Mar 2012. We analysed each image twice: once with the automatic registration and once with manual registration. This makes a total of 92 images analysed.
Performing the Image Registration
The very first image of a new Imager must always be registered manually: the user has to click the center of each of the four corner objects as accurately as possible (PTW calls this "calibrating the position"). All further images are registered automatically. If the user wants to use manual mode, he has to reset the automatic result.
After resetting, one of two "manual sub-modes" may be selected: if the radio button remains "automatic", it is sufficient to click on the corner points approximately. The software will then use this as starting point and try to find the exact location. If "manual" is selected, the clicked location will be used without further modification. For the current work, we always set the radio button to "manual" when performing the manual image analysis.
The software provides a visual feedback of the registration result in the form of blue frames around all relevant structures. If the user is not happy with the result, he may reset and try again (this only makes sense in manual mode, of course).
We used epidSoft under Windows7, 64-bit. The screen resolution was 1600 x 1200 px. We always used full-screen mode, especially when performing the image registration steps.
Types of Image Quality Tests
For both ways of image registration (automatic or manual), we recorded the image analysis results for the following tests:
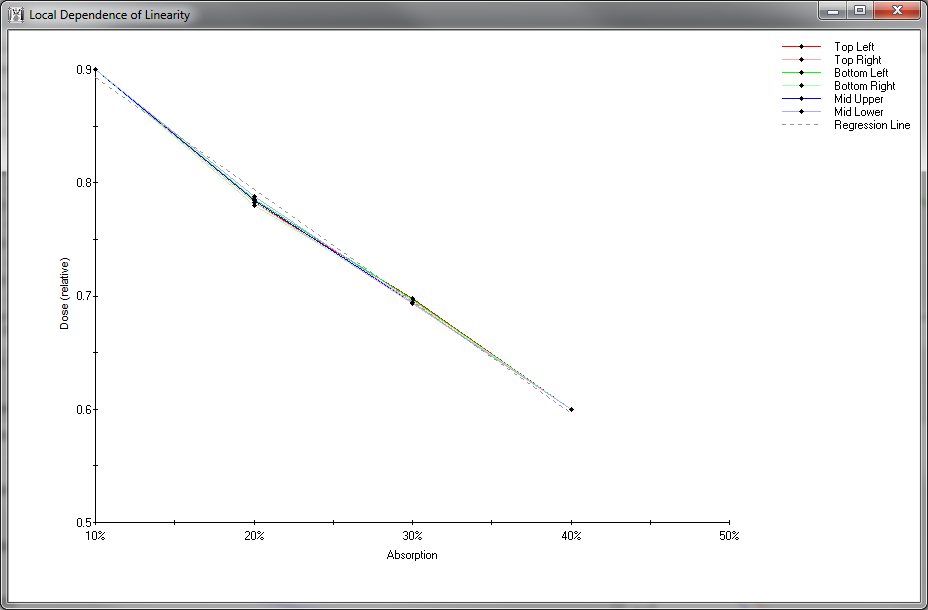
- Linearity of copper step wedges (max. deviation in %)
- Local dependence of linearity (max. deviation in %)
- Image rotation (in °)
- Signal-to-noise (SNR) ratio
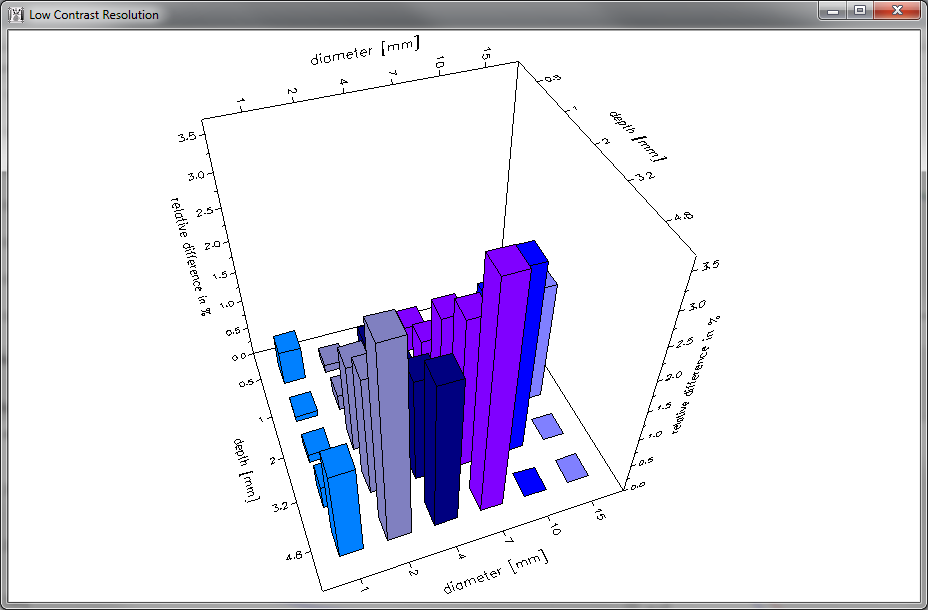
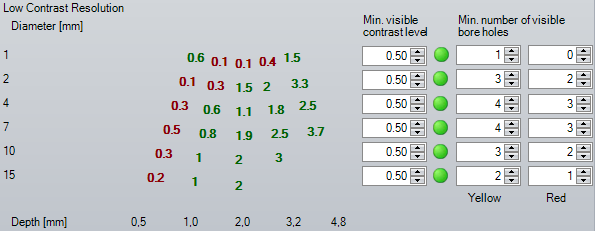
- Low contrast resolution (number of objects of different size and depth with image contrast above a set level)
By clicking on the main screen's traffic light, the user gets more test results for the current image:
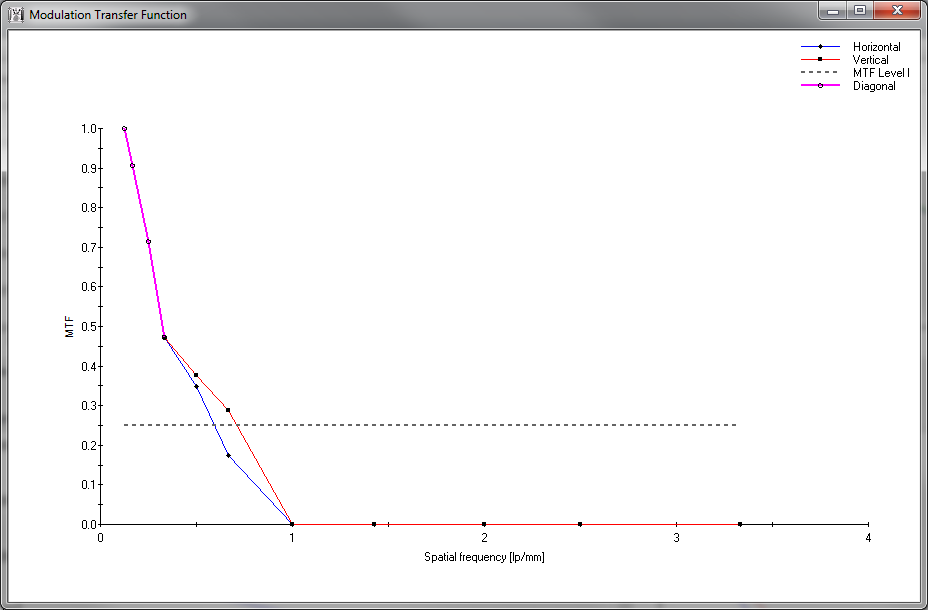
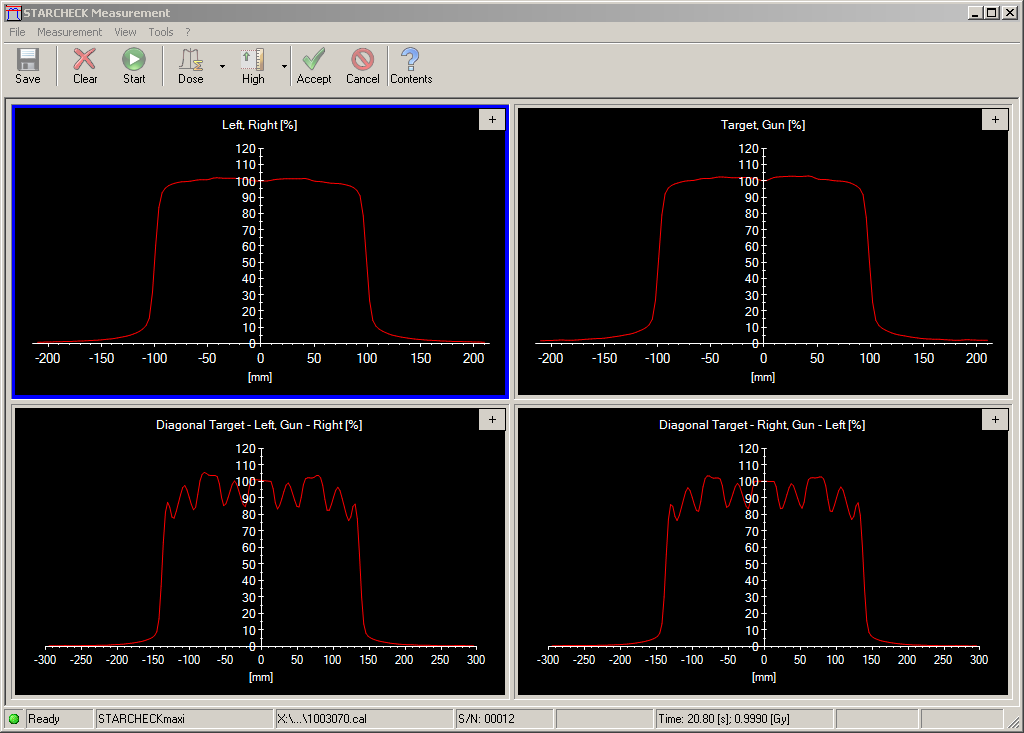
See sidebar for more details regarding the tests.
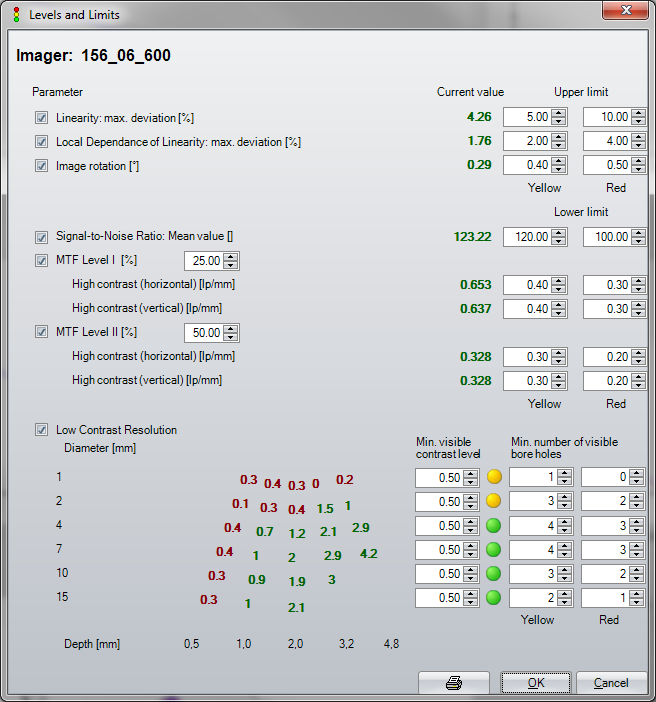
Levels and Limits
To get a pass/fail result as output, the epidSoft user may define two limits for each test beyond which the result ("traffic light") will turn yellow (test passed, but at the "warning" level) or red (test "failed"). These limits may be set independently for each Imager. They are usually defined after some experience with the actual imager has been gained. The limits clearly depend on the performance characteristics in the actual acquisition mode ("Imager").
For the low contrast resolution test, the minimum visible contrast level may be set. We use the default level of 0.5.
Results and Discussion
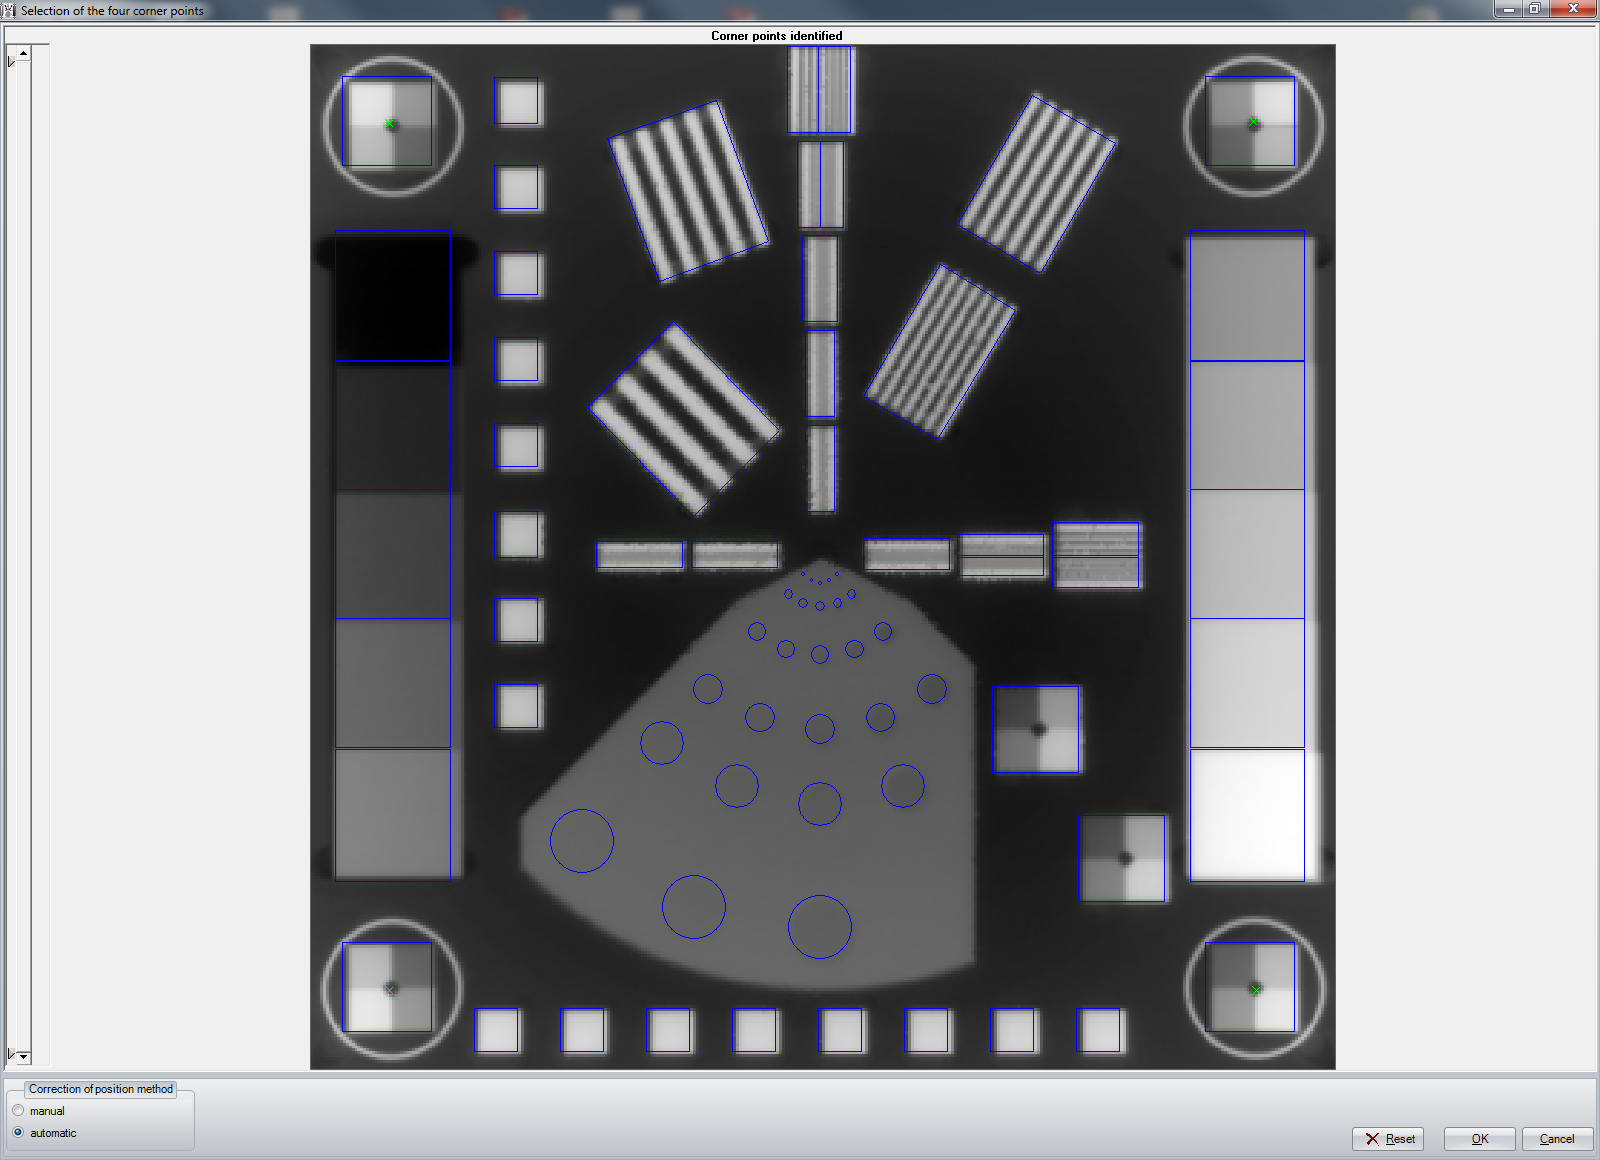
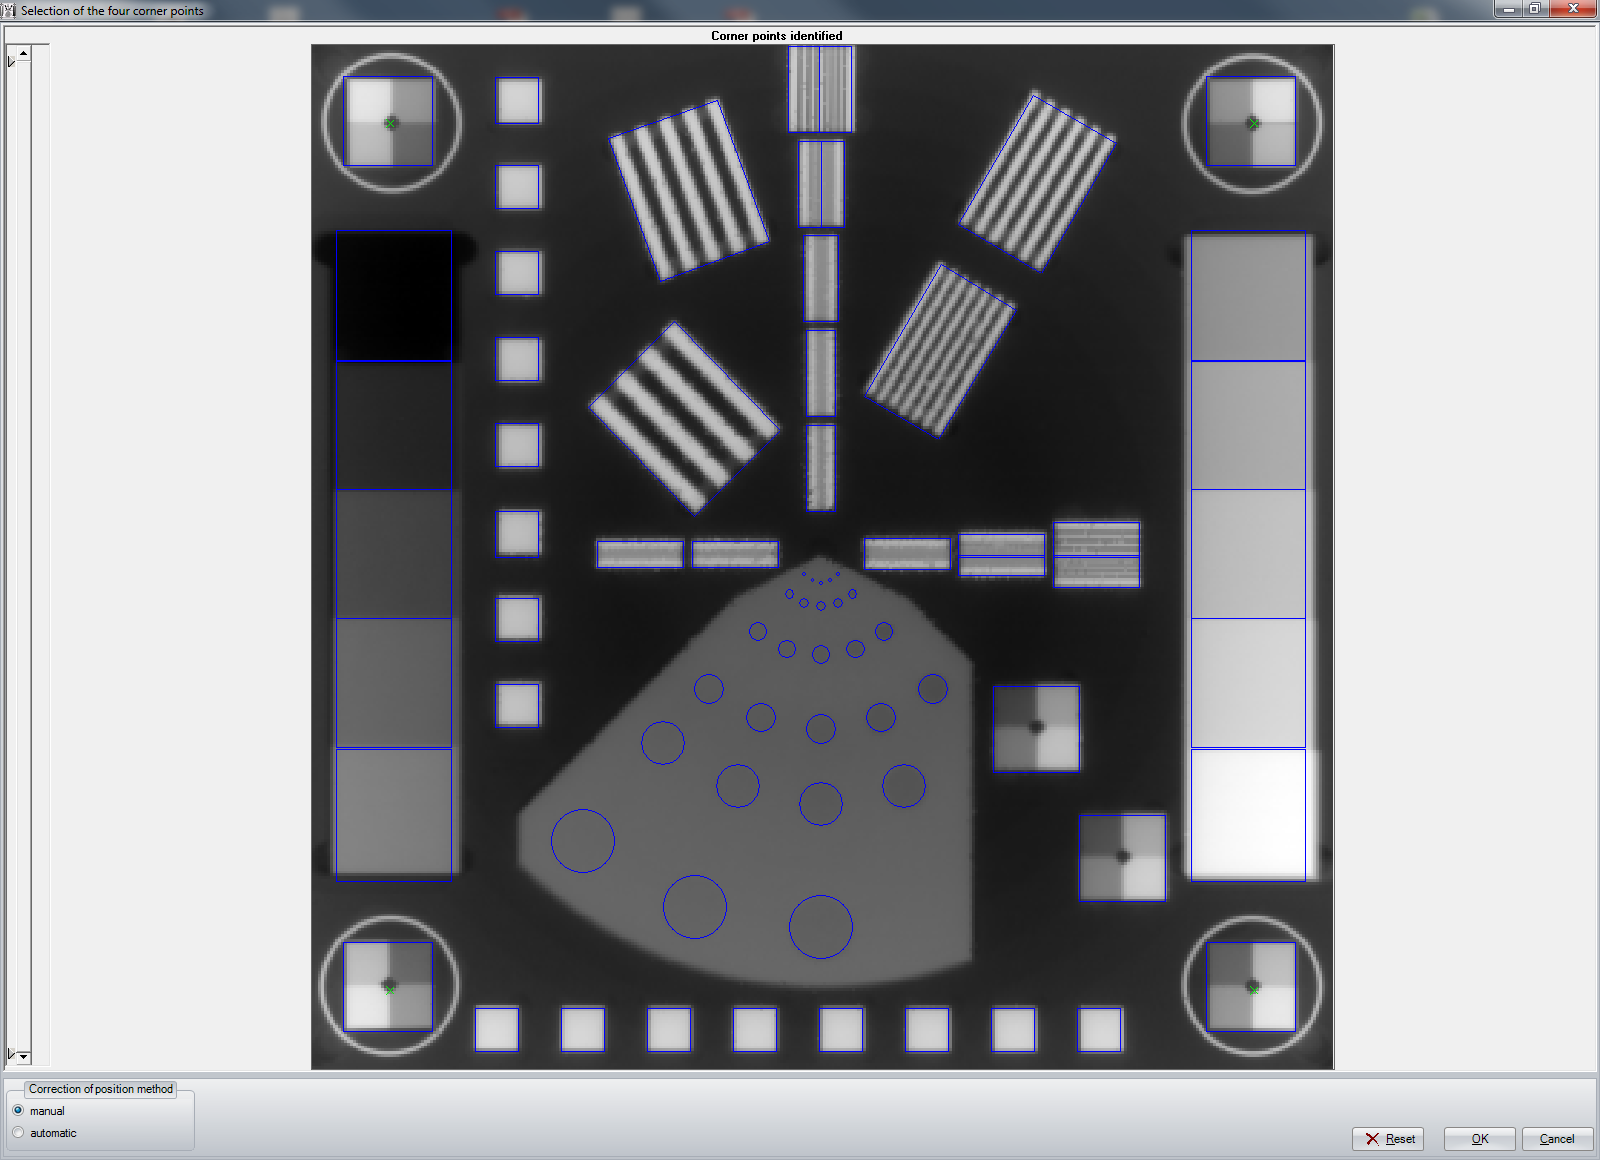
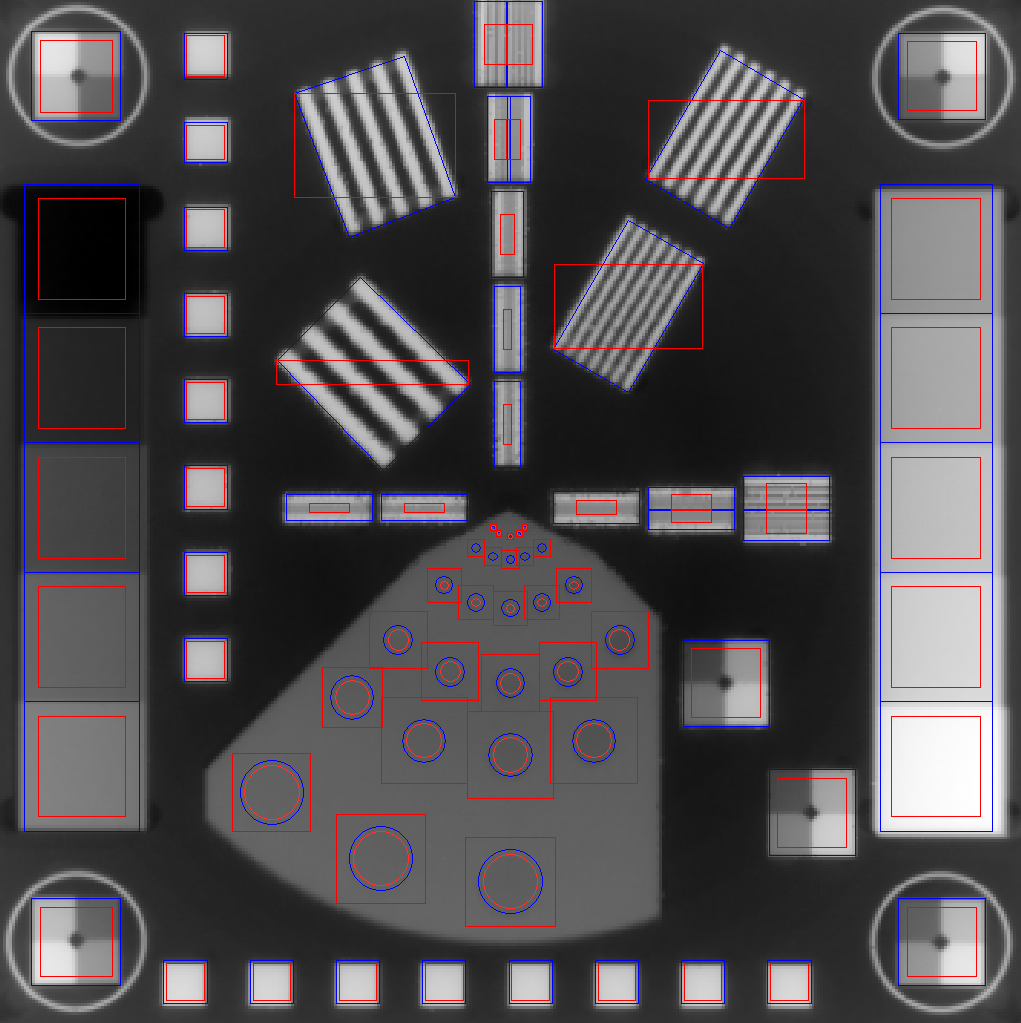
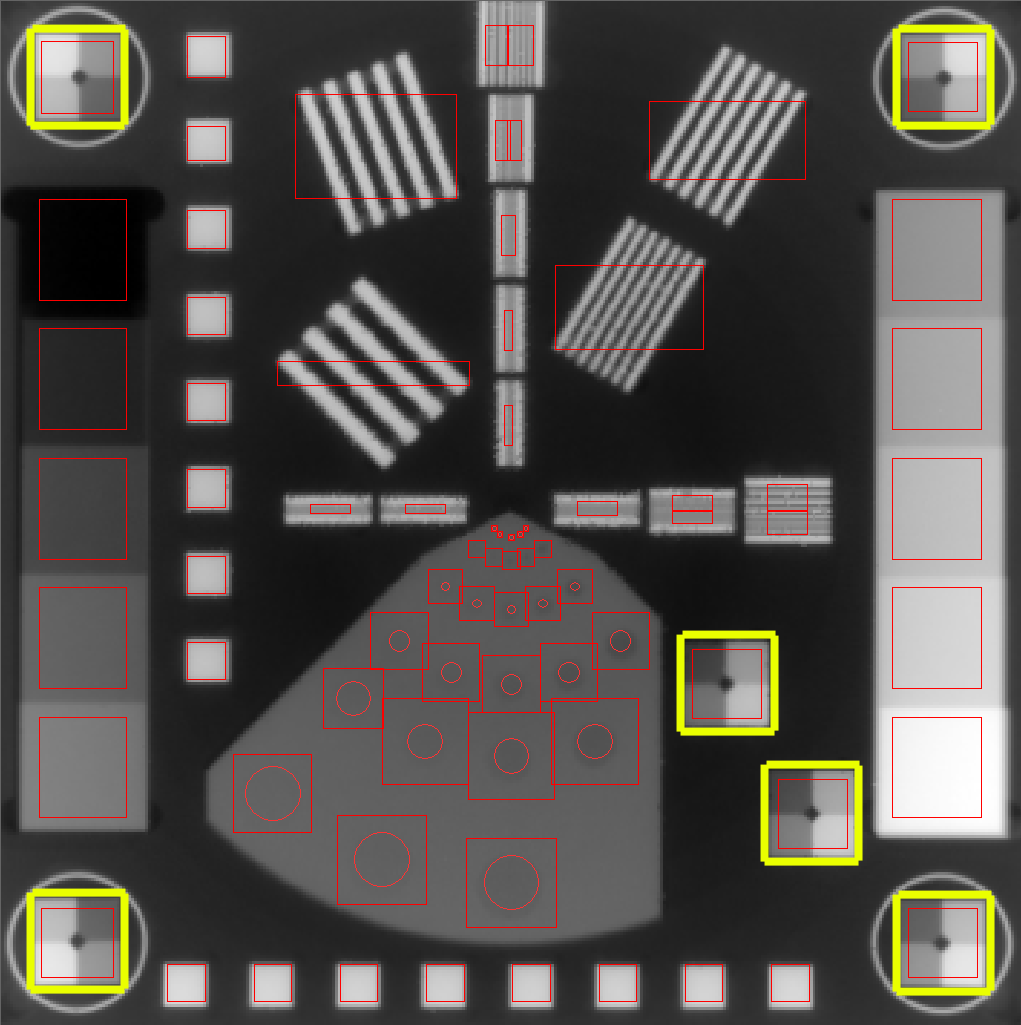
When working with the software, one strange software behavior became immediately apparent to us. When we clicked on a screen location with the mouse, the software most of the time marked a location slightly left and above this point (see Fig. 2 in the sidebar).
The visual shift of the blue frames could be a screen artefact (the blue frames appear shifted, but the image analysis is performed at the correct locations). However, the screen size (1600 x 1200 px) is significantly larger than the image size (512 x 384 px), which means that one image pixel is displayed by more than three screen pixels. This renders screen artefacts rather unlikely.
When working in automatic mode, one has to accept the registration result. In manual mode, the shifting can be compensated by clicking on a location somewhat right and below the target point.
Visual Check of Registration Results
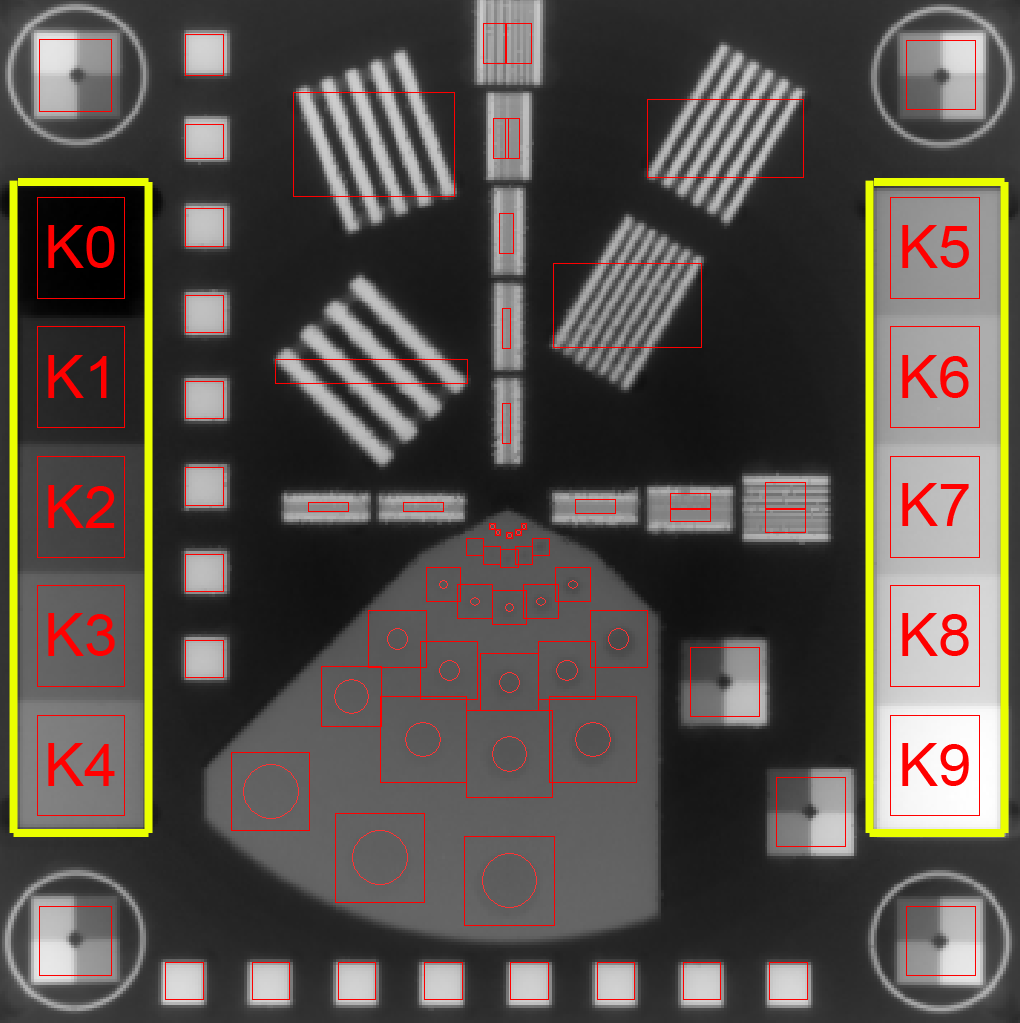
Screenshots of the image registration process are available as ZIP archive (~ 7 MB each) for the 156_6_100 Imager and the 156_6_600 Imager. File names either end with "_man.png" or "_auto.png", reflecting the mode of registration. By clicking through the screenshots, one can visually check the registration results in both modes. The upper left corner objects after typical automatic and manual registrations are displayed in Fig. 2 and 3.
Results of Image Quality Tests
The main question is: will the shift in automatic mode significantly affect the test results of image analysis?
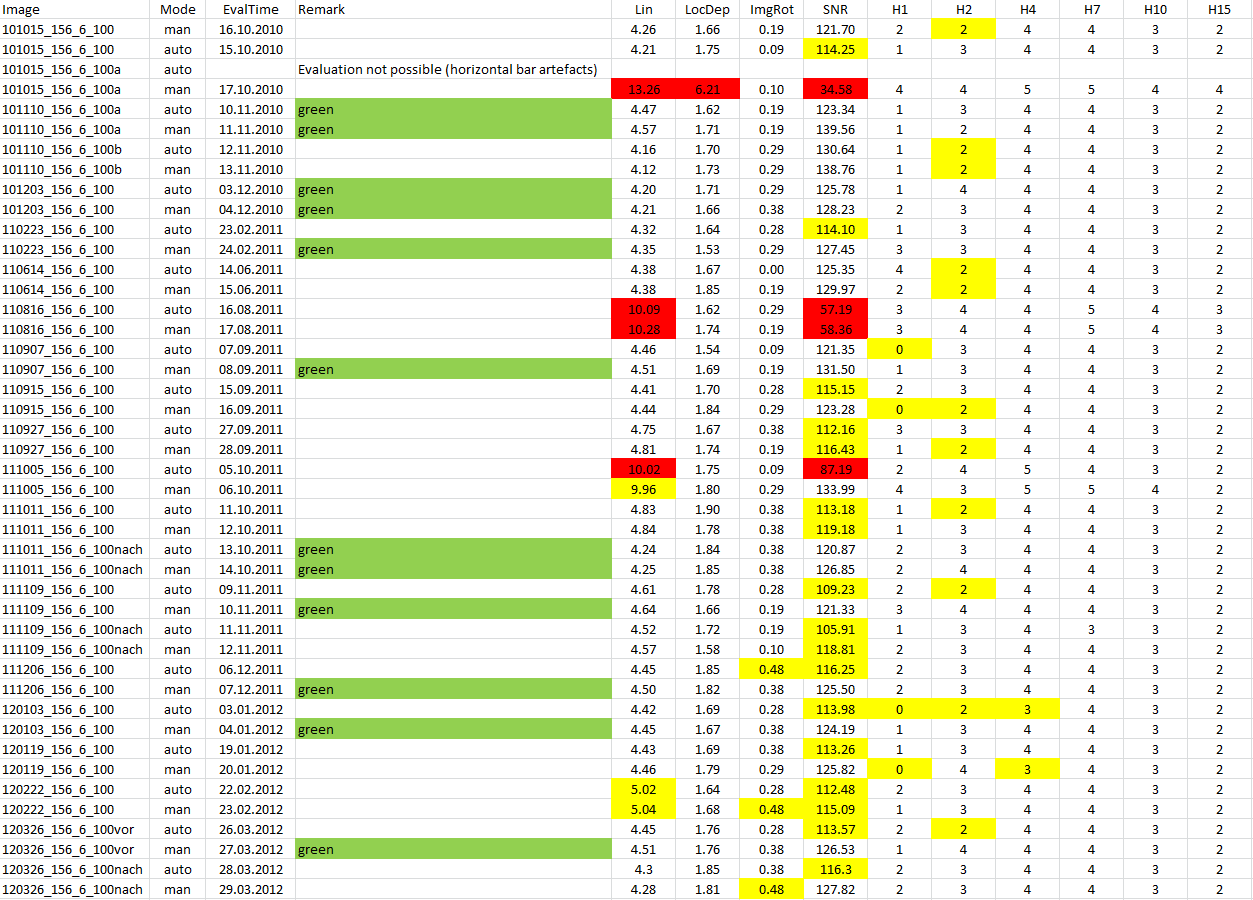
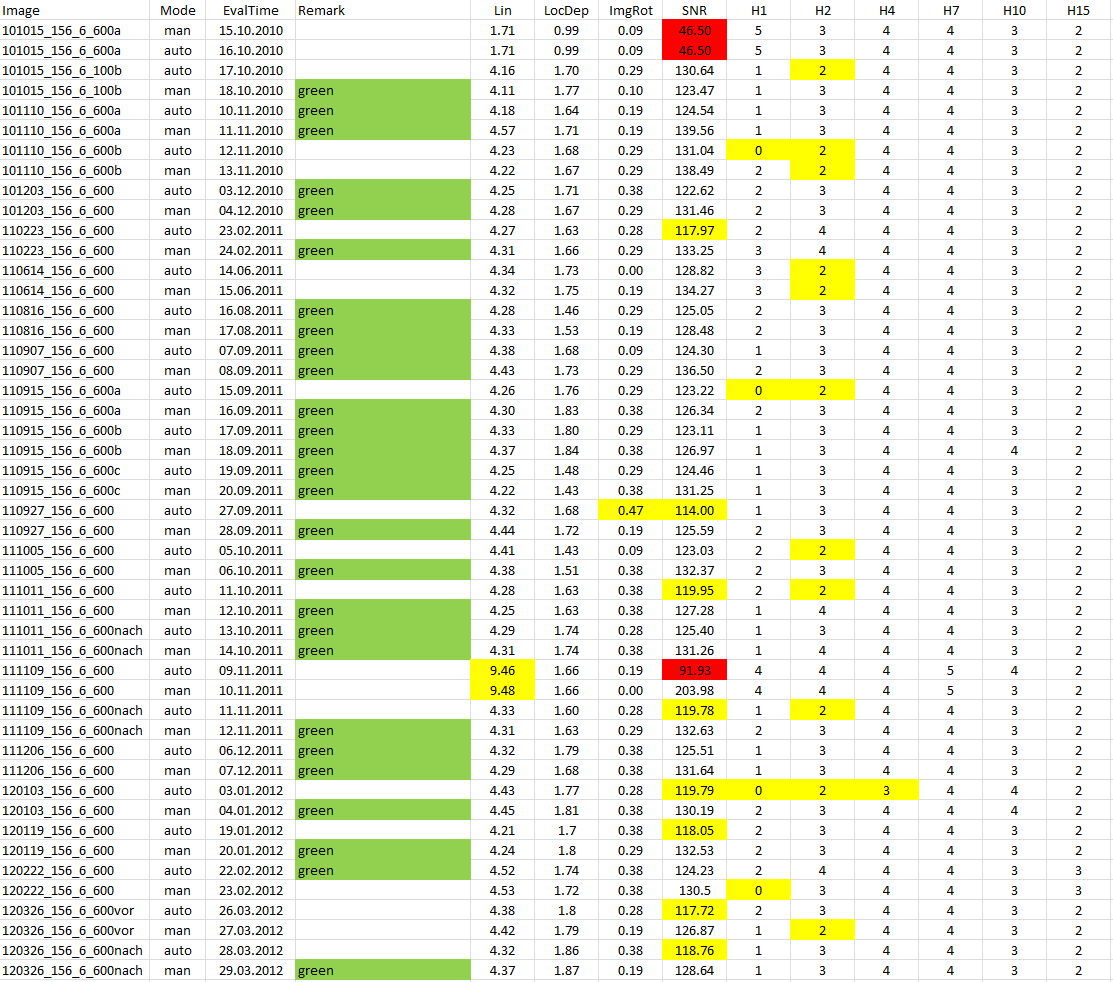
The following table displays the analysis results for the 156_6_600 Imager (see also the corresponding 156_6_100 table). It contains the test results for linearity, local dependence of linearity, image rotation, SNR and the number of detected low-contrast holes (H2 for instance means the number of holes with 2 mm diameter where image contrast is at least 0.5). Where one or more test limits were exceeded, the parameter that caused the problem is highlighted (red and yellow fields):
The complete test results for the 156_6_100 Imager and the 156_6_600 Imager can be downloaded as Excel files.
For both Imagers, there are generally more green and less yellow results after images had been registered in manual mode. For the 156_6_100 Imager, the results are 3 green, 16 yellow, 2 red for automatic mode, and 9 green, 11 yellow, 1 red for manual mode. For the 156_6_600 Imager, the results are 3 green, 16 yellow, 2 red in automatic mode and 9 green, 11 yellow, 1 red in manual mode.
Because the definition of the limits is somewhat arbitrary, the color fields do not tell the whole story. A graphical data plot without limits shows the differences between the modes more clearly. The graphs are also in the Excel-sheets.
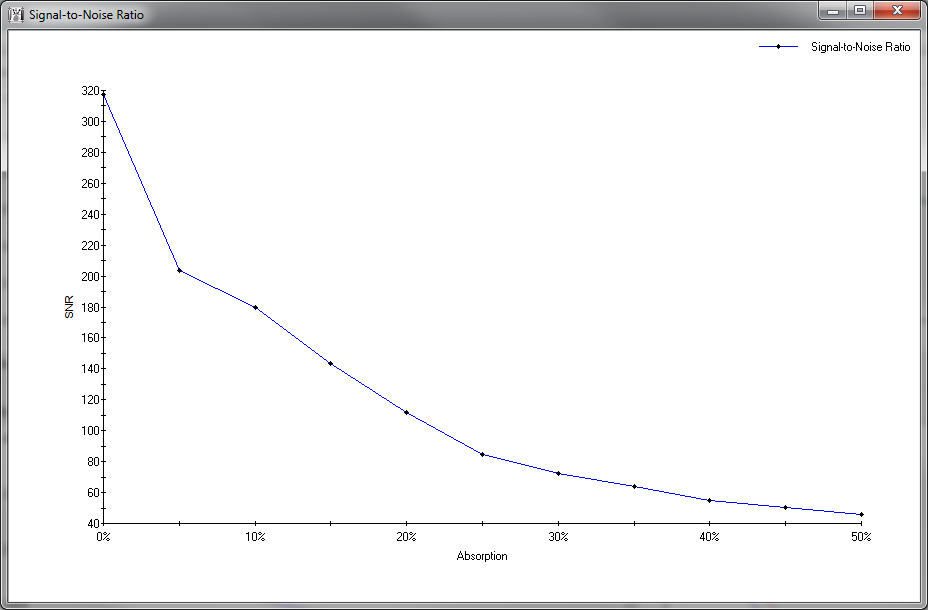
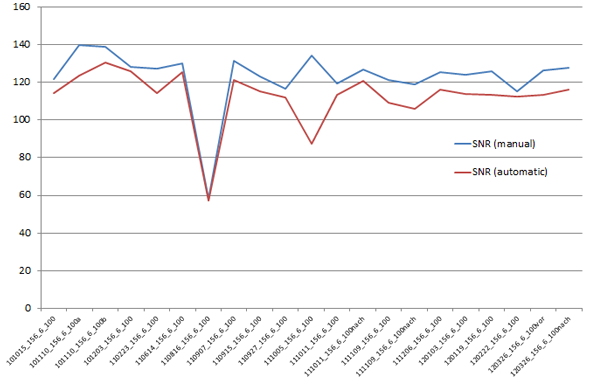
Signal to Noise Ratio
SNR is usually better (higher) when manual image registration is chosen, here for the 156_6_100 Imager:
The same is true for the 156_6_600 Imager:
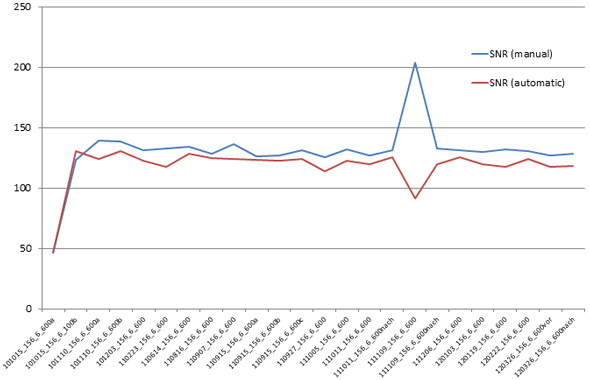
Our SNR warning level for the two Imagers is 120. This means that when SNR drops below 120, the result turns yellow. For the two Imagers in the analysis, the limit is just between typical manual and automatic registrations. This is why a significantly higher number of images is "green" after manual registration.
The reason for the difference is probably because the regions of interest which are used for the SNR calculations are better centered on the two copper step wedges after manual registration.
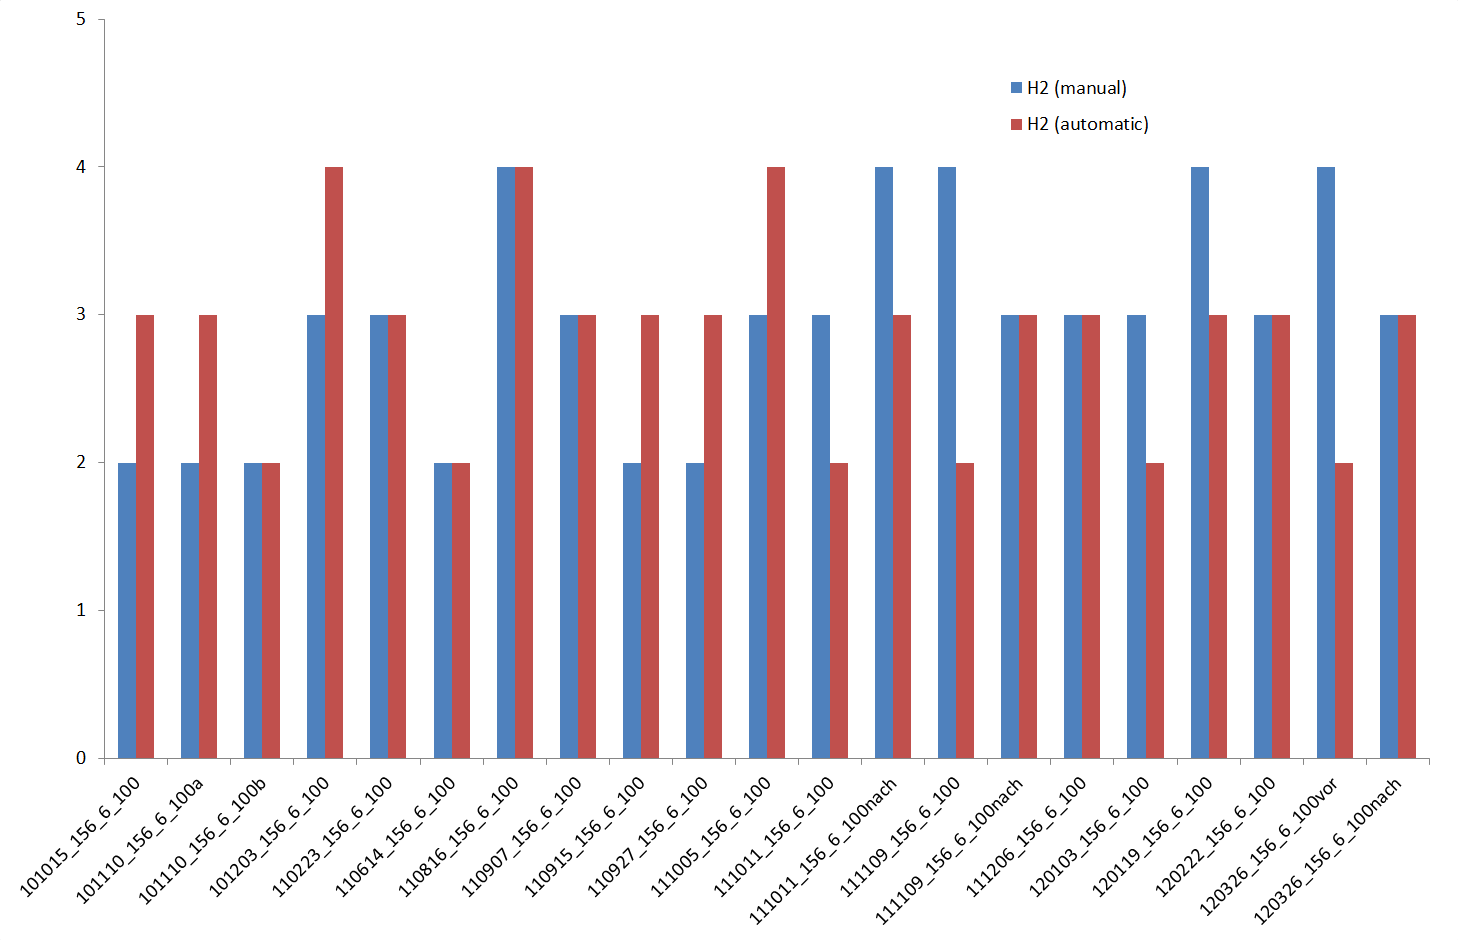
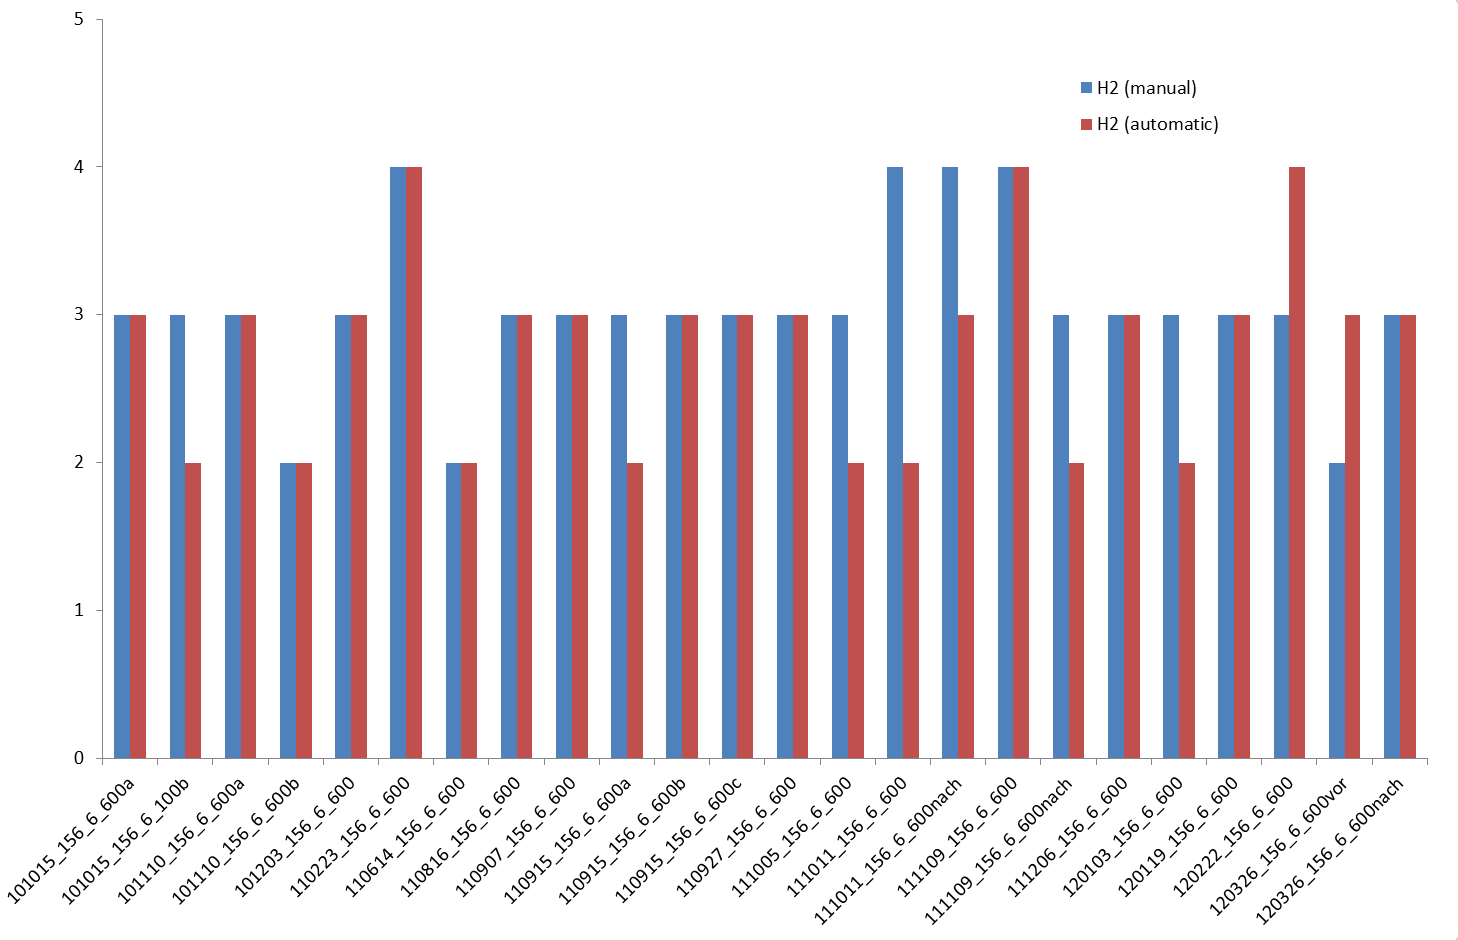
Low Contrast Ratio - H2
H2 is the number of holes with 2 mm diameter that give image contrast larger than 0.5. Here are the H2-results for 156_6_100 and 156_6_600.
It seems that we have set the limit for H2 rather tight. At least 3 holes are necessary for "green", 2 holes already give a "yellow" result. For seven images of the 156_6_600 Imager, the manual result is better than the automatic, whereas only for two images the automatic result is better. In other words, manual mode wins 7:2. For the 156_6_100 Imager, both modes give comparable results.
The fact that manual registration produces much less yellow results seems to confirm that a better registration has an impact on the traffic light only in such cases where the limit is tight: If it were looser (e.g., min. 2 holes for green), all H2 results would be green, since in every image of the 156_6_600 Imager there are at least two H2 holes with 0.5 contrast.
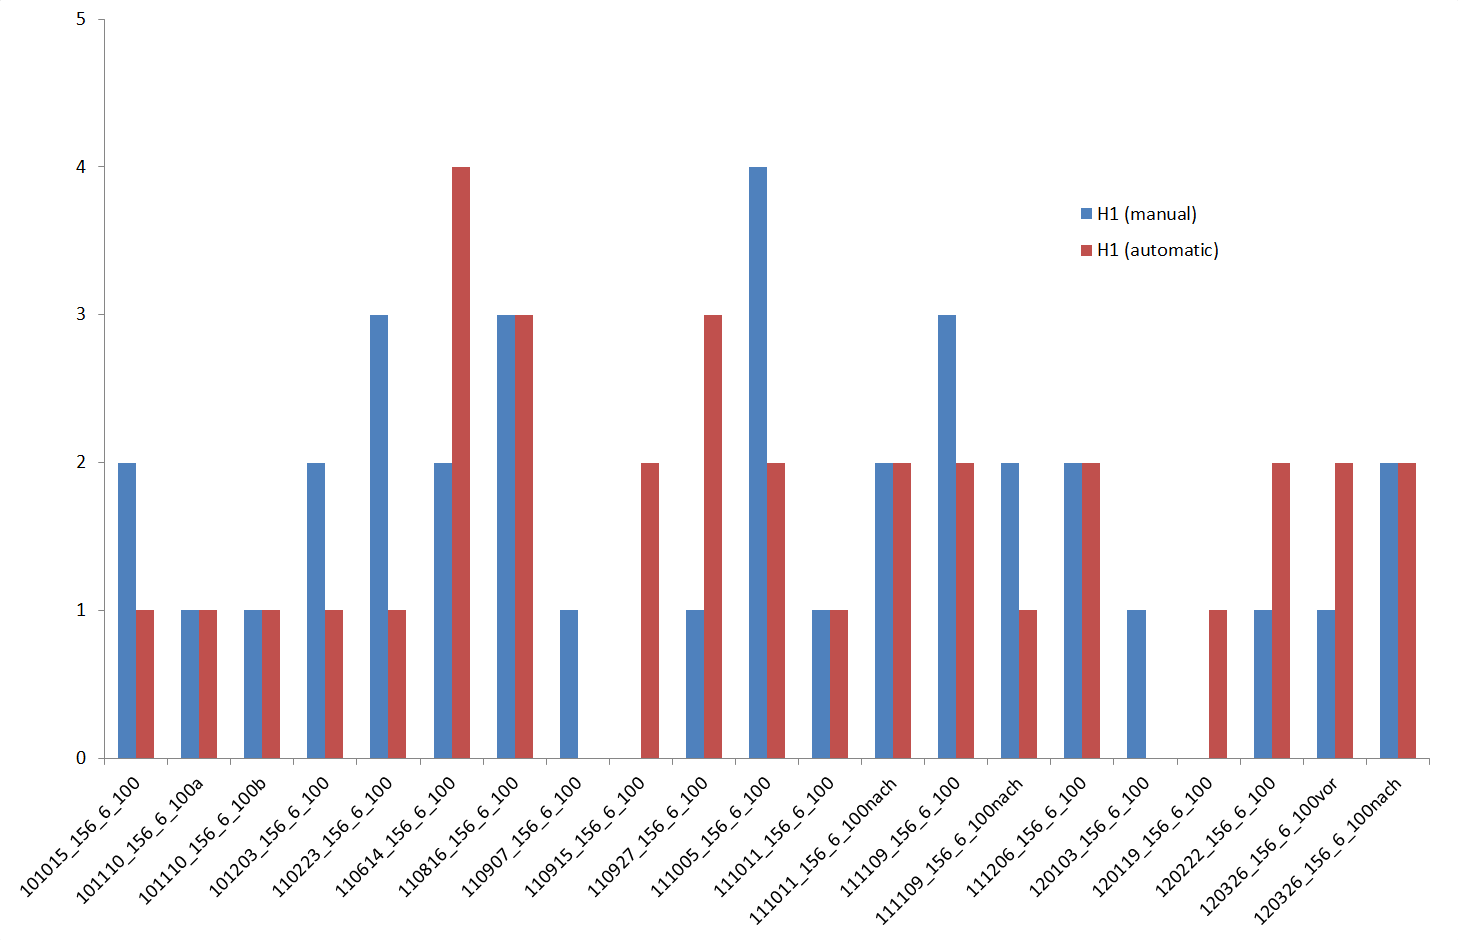
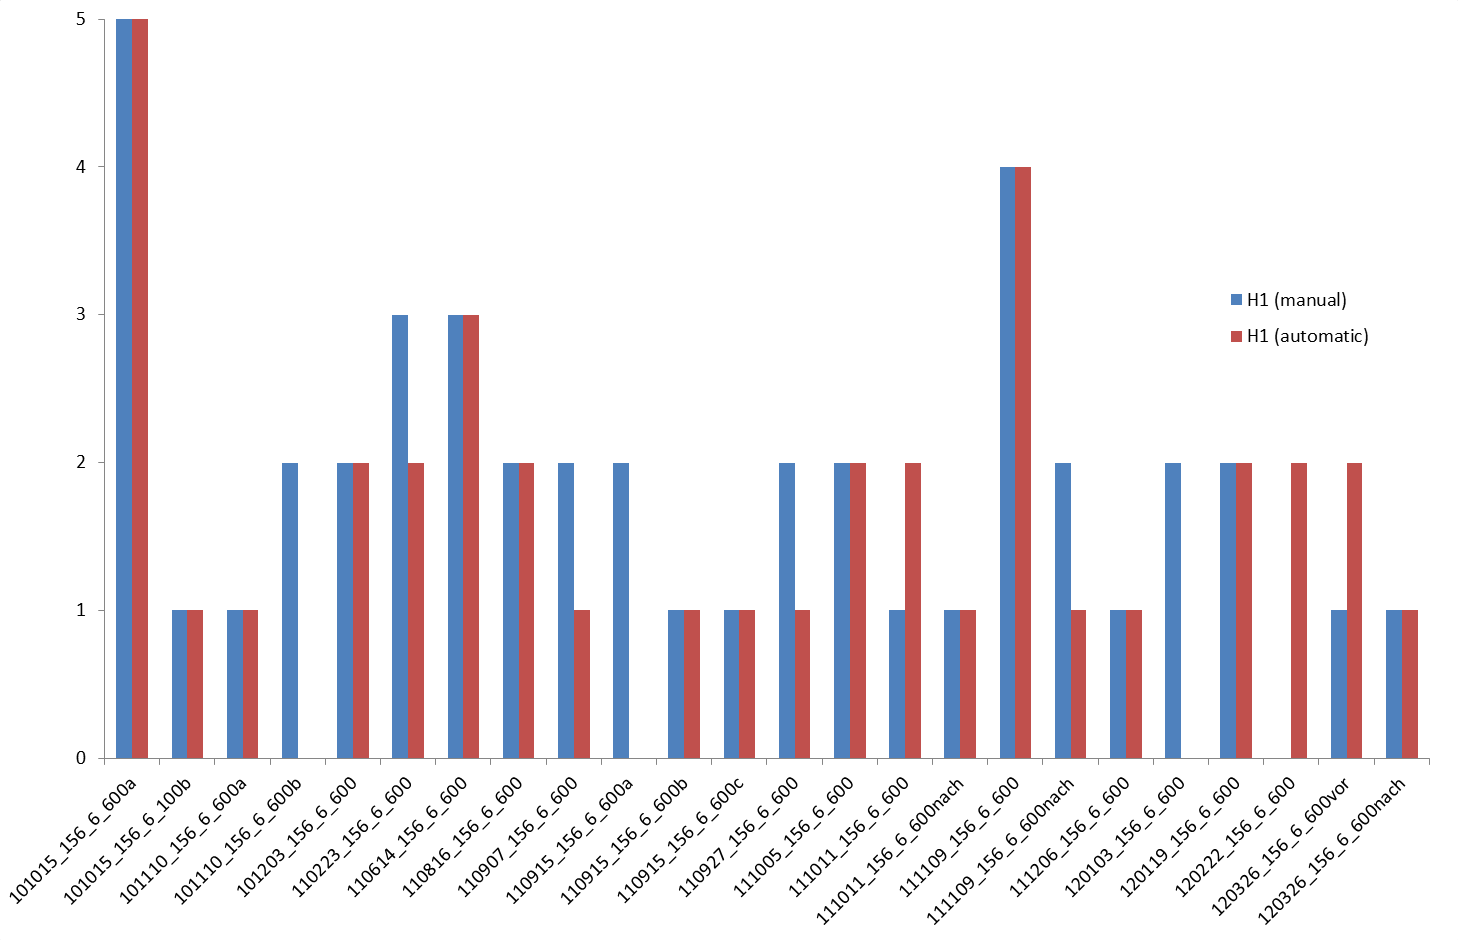
What was said here about H2 is more or less also true for H1. Here are the H1-results for 156_6_100 and 156_6_600. Here manual mode wins 7:3 for the 156_6_600 Imager, and 8:6 for the 156_6_100 Imager.
Other Tests
In our opinion, there is no visible impact of the registration mode on the results of all the other tests (linearity, local dependence of linearity, H4 - H15).
Image rotation is not really an image quality test, but rather an indicator of some mechanical problem. In our case, the IDU is slightly rotated by 0.3°, which is a purely mechanical problem (a problem that - according to Varian - cannot be corrected on our 16 year old machines). The set limit of 0.5° means that only an extra 0.2° is allowed for the image registration process. Therefore, a failed test due to a rotated image shouldn't be taken too seriously.
Conclusion
The result of an image quality assessment should depend on the image alone, and not on the mode of image registration. However, we analysed our images with epidSoft and saw that the results after automatic registration could be improved when the same image was registered manually. For certain tests (SNR, H1, H2), automatic registration had a negative impact on measured image quality. For other tests, no difference could be found.
One advantage of automatic mode is reproducibility. If the same image is analysed several times, the tests will always have the same result. In manual mode, it is always possible that a slightly different registration would produce a better result.
Taking into consideration that the number of Imagers depends on the number of acquisition modes (we have currently 5 per linac) and that the overall time budget for linac QA is small, an accurate and fast automatic registration would be highly appreciated.
1We do not distinguish between "low dose" and "high quality" acquisition modes. We have set up our system to aquire the same number of frames in both modes.