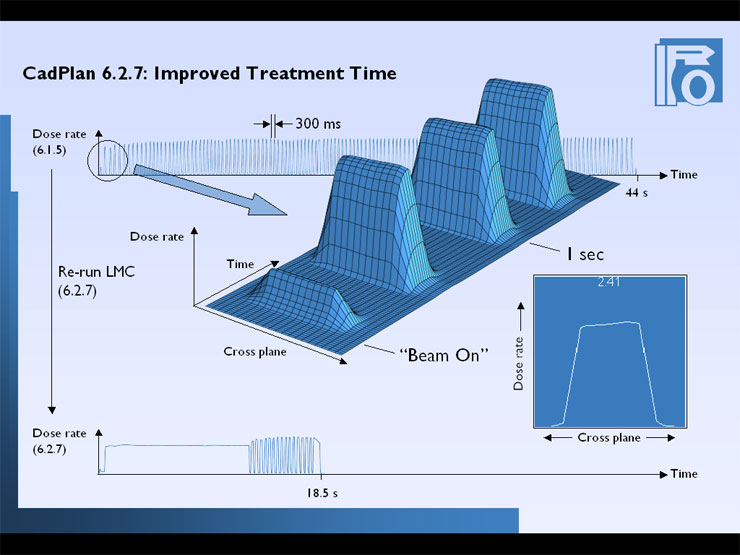
With CadPlan 6.2, beam holds could be reduced to a large extend by avoiding closed leaf pairs (with the parameter Minimum Leaf Gap). This improvement is shown in this slide. This is the dose rate pattern for a complete treatment (this was for patient #3), generated by the LMC of CadPlan 6.1. The total treatment time was 44sec. Its difficult to show this in a single plot because the curve contains nearly 5000 points and oscillates very rapidly. The time between two dose rate peaks is about 300ms. If we take a closer look at the profiles of the first four peaks, we get this plot, here is BeamOn, this is one second later. If we recalculate the leaf motion pattern of this field with the newer LMC we get this dose rate. Treatment is complete after 18.5s, which is less than half the old value. This is a real time animation of this measurement. The symmetry looks awful, but this is because its an asymmetric field. Central axis is about here. Dose rate is stable for the first 12 seconds, and only then, some pulsations occur. So this was a big improvement when going from CadPlan 6.1 to CadPlan 6.2.