What Can We Learn from Poor VERIQA Results?
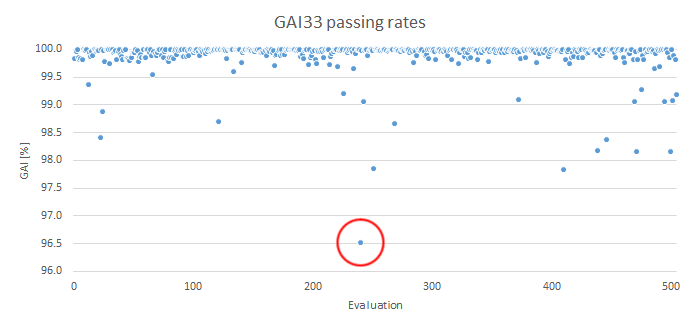
Our VERIQA results are generally excellent. However, looking at some "outliers" can give valuable insights. We will investigate the plan which had the poorest GAI33 (circled) in our previous post, and look for the reason:
The VMAT Plan
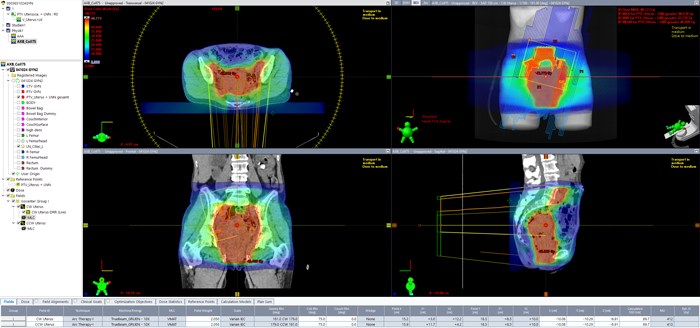
A very large PTV (uterus plus lymph nodes, volume: 963.3 cm3, length: 21 cm) was optimized for a mean target dose of 23 x 2 Gy = 46 Gy (organs at risk: bowel bag and rectum). The selected plan setup was two arcs (CW/CCW) and 10 MV energy. Due to the length of the PTV, which is close to the maximum MLC length of the HD120 MLC of 22 cm, the planner used small collimator angles (10°, 350°) for the two arcs.
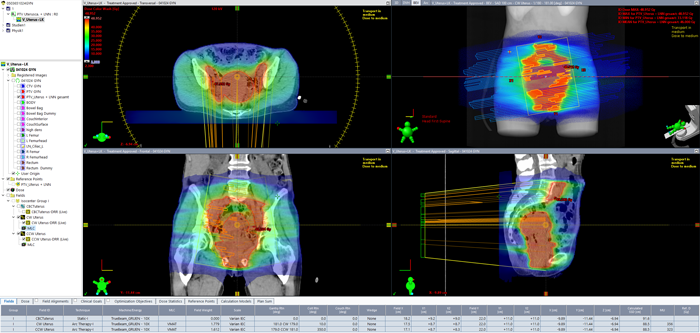
(Dose distribution of the clinical uterus plan. Note the large MLC field in Beams-Eye-View.)
The VERIQA evaluation result (GAI33 = 96.52%) was well above the warning level of 95%, and the plan was accepted. However, viewing at the Gamma map revealed that the Gamma test had failed outside the target, in the low dose regions at the cranial and caudal ends1 of the evaluated volume, where dose level had dropped below 5 Gy or about 10%:
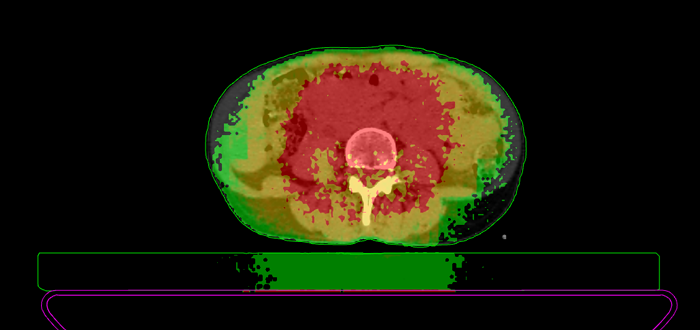
(Red: GAM33 test fails at the cranial end of the evaluation volume, outside the PTV. Slice at z = 56 mm.)
Transferring the plan to RT View gives more information. In profile comparison mode, the lower right profiles run from feet to head. While the overall profile agreement in the high dose region is close to perfect, the discrepancy at the cranial side can be clearly seen (red arrow):
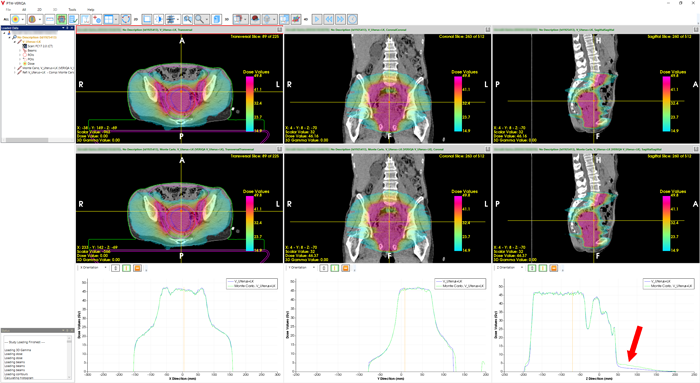
(RT View: AXB plan with poor agreement (arrow). All profiles run through isocenter.)
The next image displays the profiles at z = 56 mm, which is the slice from the Gamma map shown previously. All profiles use the same vertical scaling:
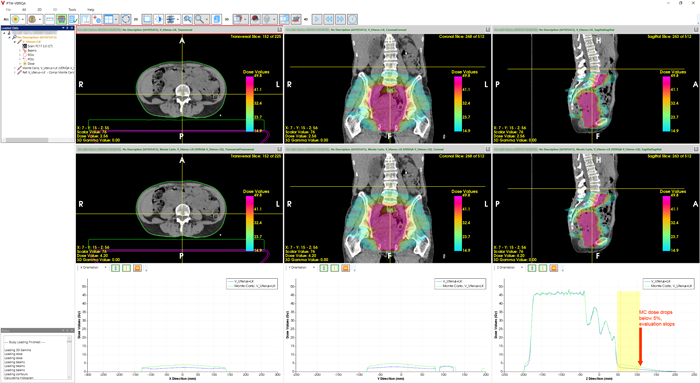
(Profiles at z = 56 mm. Yellow shading: region between 5% and 10% of maximum compared dose.)
VERIQA tells us (not shown), that the maximum MC dose in the volume is 49.81 Gy, which means that 5 Gy and 2.5 Gy are the 10% and 5% levels, respectively. The yellow shading marks this z-range2.
But where does the disagreement come from? This is an interesting case because the problem could have its origin in AXB beam modelling.
The Problem with the Tails
A somewhat larger out-of-field dose discrepancy for AXB compared to AAA had been observed much earlier: when we wrote about collecting beam data for Eclipse 11 in Nov 2013 (more than ten years ago), we also posted screenshots of Eclipse Beam Configuration (see "Eclipse Beamdata for AAA and Acuros XB"). In the sidebar of the linked page, the reader will find Beam Configuration screenshots of e.g. AAA11031G5-X6 and AXB11031G5-X6, which compare the calculated and the measured profiles for a 200 x 200 mm field. In the tail region of the profile, AXB dose was always a little too low, for all energies. At a distance of 110 mm off axis, the difference between AAA and measurement in 50 mm depth is about 1.5%, whereas for AXB it is over 3.0%.
In principle, this hasn't changed much since version 11: In Eclipse 18, the difference at the same off-axis point is about 2.1% for AAA and 3.0% for AXB. Here is an overlay for the 6 MV, 200 x 200 mm field in 50 mm depth.
If we switch to the correct energy of our "case", which is 10 MV, the Beam Analysis comparisons for the 200 x 200 mm field, depth 50 mm, for AAA and AXB look like this:
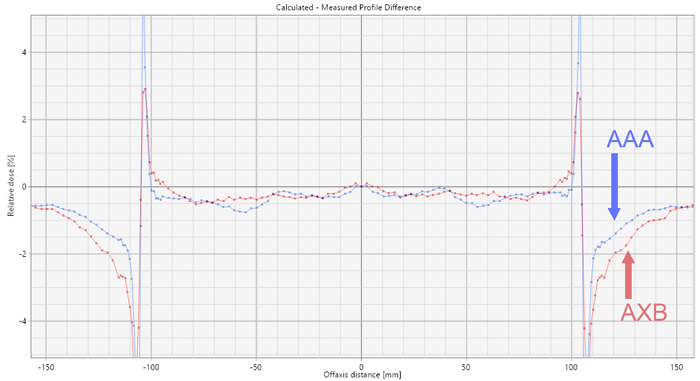
(Beam Analysis comparisons for 10 MV, 200 x 200 mm field, depth 50 mm, AAA and AXB in version 18.)
Remember that these are difference plots, not profile plots: in the tails, the AAA curve is closer to zero meaning closer to measurement. It is negative which means that the AAA profile is lower than the measured profile. AXB is even lower, which results in a larger (negative) difference.
How do we know that this has something to do with the observed discrepancy in VERIQA?
Extending the Tails with Scatter
Long target volumes require long VMAT fields. If the field length approaches the limit of 22 cm, all 60 leaf pairs of the HD120 MLC are moving around and hit by radiation. Due to the tertiary design of the Varian MLC, the scattered radiation of the leaves in extremely large fields is neither shielded by jaws, nor by static leaf pairs which normally would be closed at the ends of the leaf banks. If the collimator rotation is small (e.g., 5° - 30°), the scattered radiation of the MLC will therefore extend the tails of the low dose region at the cranial and caudal ends of the treated volume.
The CW arc of the plan in Beams-Eye-View illustrates the situation. Watch the Y2 (and Y1) sides:
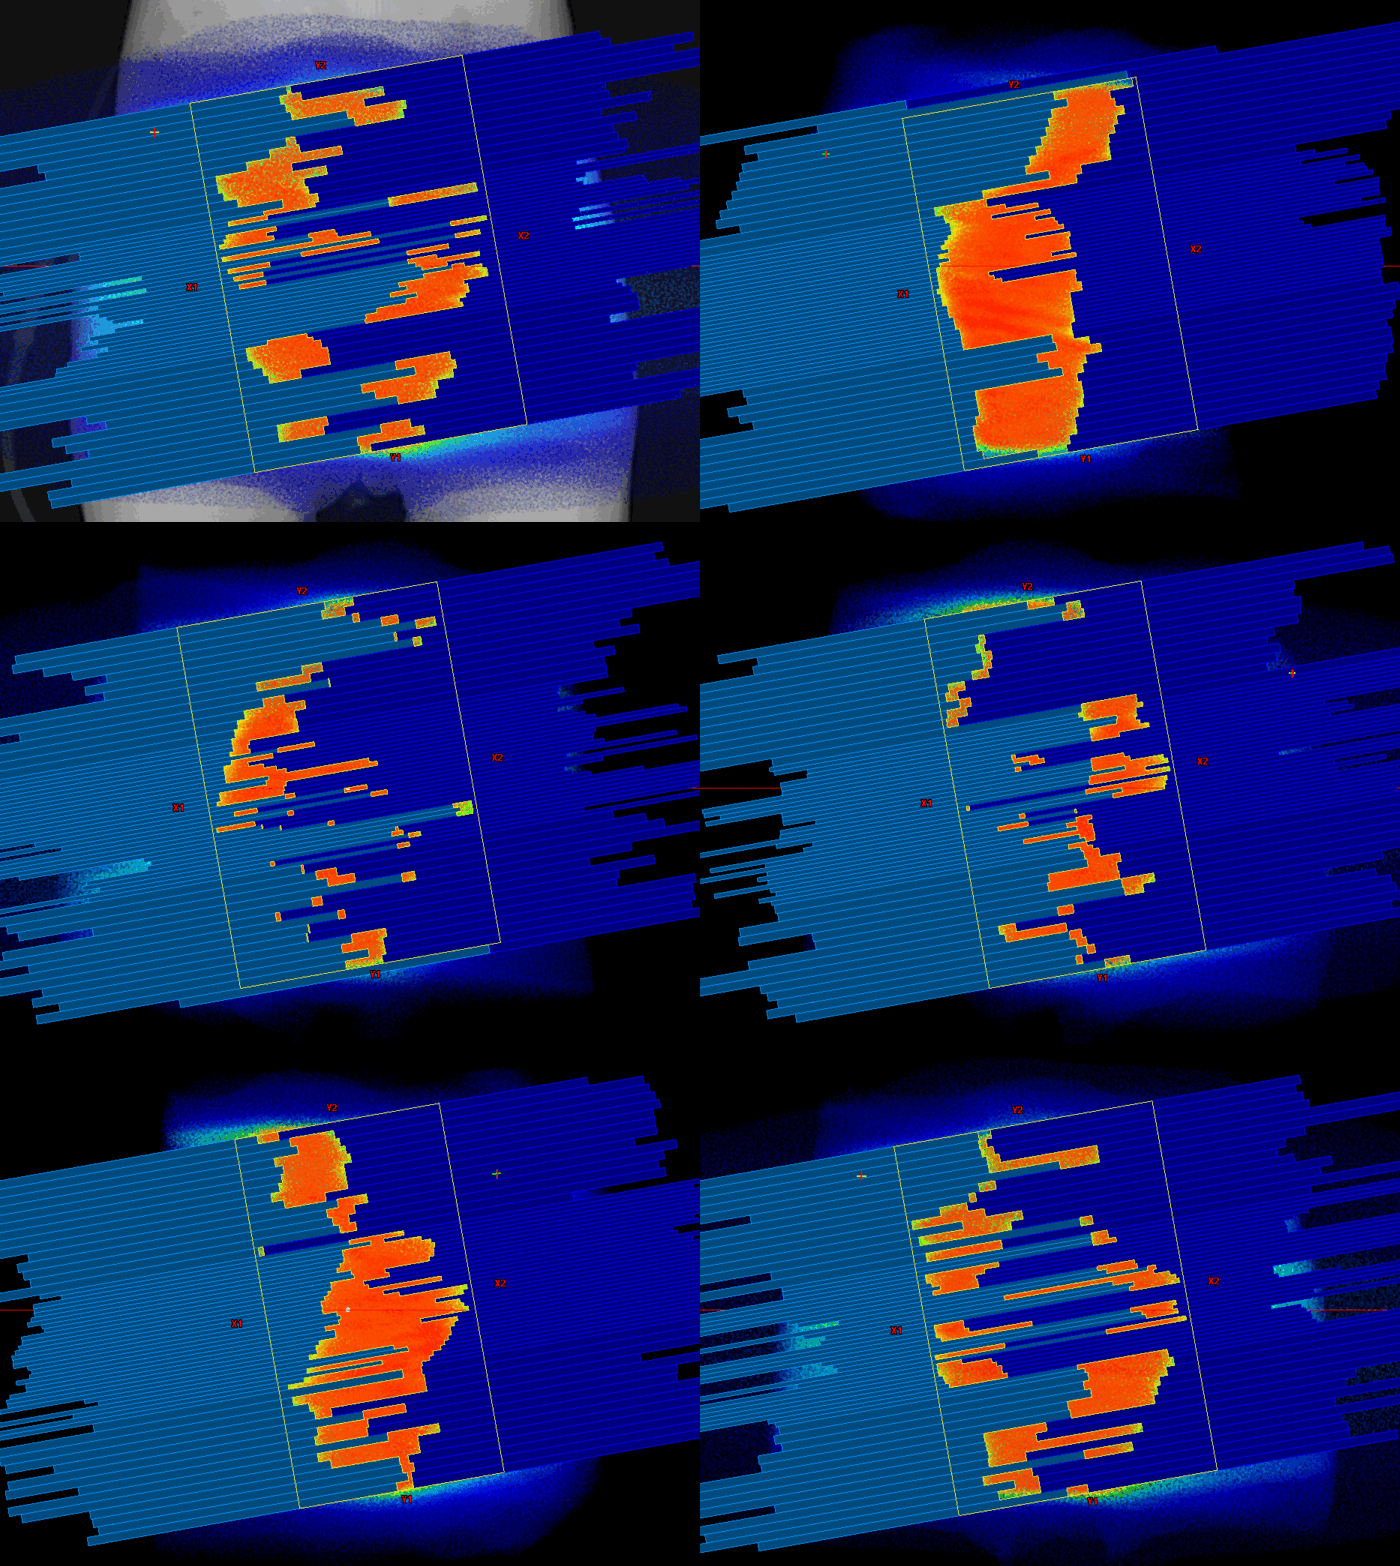
(The CW arc of the original plan. All leaf pairs are in motion.)
This is where the algorithms come into play. Although out-of-field dose is modeled well in both algorithms since Eclipse version 13, it makes a difference whether AAA or AXB is used for such a plan. If AXB is too low in the tails of a profile (as mentioned above), this could explain the discrepancy between Eclipse and SciMoCa.
AAA Recalculation
If this theory is correct, switching to AAA without modifying anything else in the plan should improve the GAM33 results at the cranial and caudal ends of the evaluated volume.
To verify this, we copied the AXB plan (new name: "AAA"), changed the algorithm, recalculated dose and sent it to VERIQA.
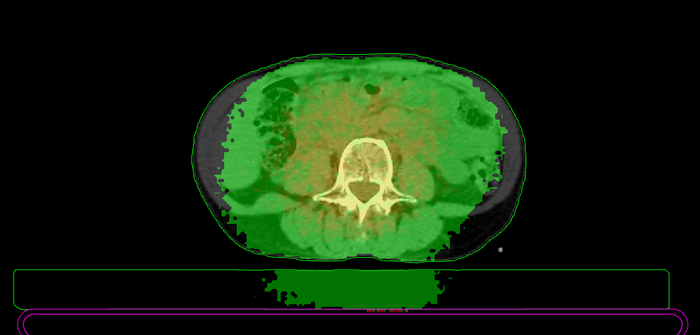 (GAM33 for the AAA-recalculated plan at z = 56 mm. All Gamma values are below 1.)
While the GAI33 of the original AXB plan had been 96.52% (GAI22 = 86.85%), the AAA-recalculated plan has GAI33 = 99.54% (GAI22 = 96.12%).
RT View paints a more differentiated picture. While in the high dose region AAA and MC agree well but a little less perfectly, the tail region is clearly better in AAA compared to AXB. Since in the high dose region both algorithms had passed the test, the tail region decides the match:
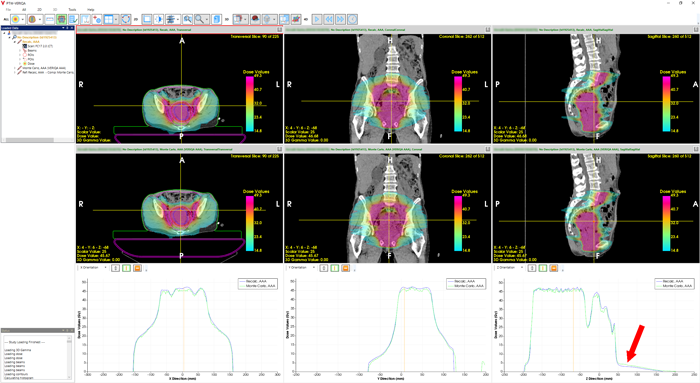
(Original arc setup, AAA recalculation. Significant improvement in the cranial scatter region. GAI33 = 99.54%)
Static Fields
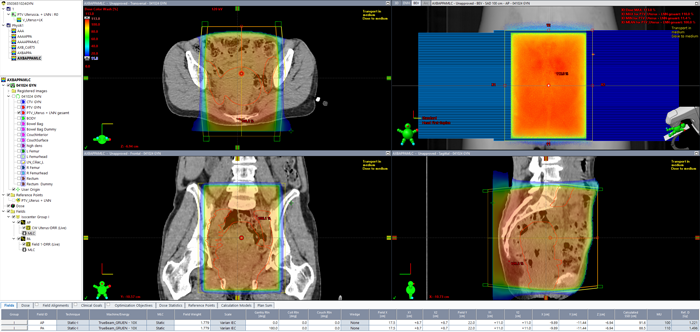
The theory can also be checked with simple AP/PA field setups. One plan uses open fields (22 cm long), the other plan MLC fields where the jaws are set to 22 cm length, but the MLC opening is only 21 cm long. This way, leaf pairs 1 and 60 are exposed to radiation:
Both plans were calculated with both algorithms and sent to VERIQA. Since we are only interested in the cranial tail region, we send them to RT View for profile analysis right away.
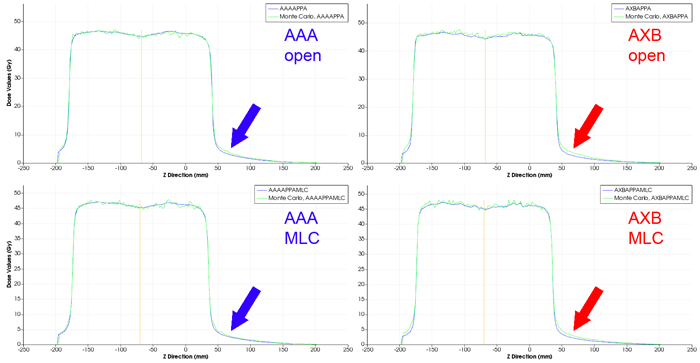
The results seem to support our theory, although the effect is less pronounced than for the VMAT plan. Static, opposing fields show better agreement in the tail region if calculated with AAA. The AXB profile (red arrow) again is a little too low:
When comparing open versus MLC however, there is no big change. In the contrary: single closed leaf pairs 1 and 60 seem to work as an additional collimator, and do not increase scatter. Closing the outermost leaf pairs alone is no valid simplification of the complex scatter situation during VMAT.
A "trumpet" like MLC shape should produce more scatter at both ends. We set the plan dose maximum to 100 Gy. This way, with the color wash scale starting at 5 Gy, the blue areas visualize our 5% dose threshold in VERIQA:
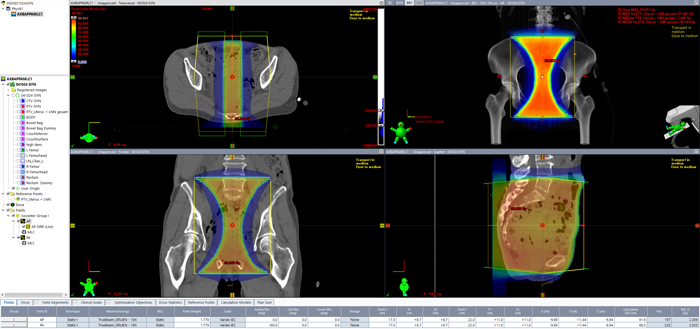
(Another attempt to produce scatter: the "scatter trumpet", AXB version.)
The plan again was calculated with both algorithms and sent to VERIQA. At slice position z = 50 mm, the GAM33 map looks similar to the VMAT plan. Also note that dose inside the foam mat between the patient and the Exact couchtop is better reproduced in AXB:
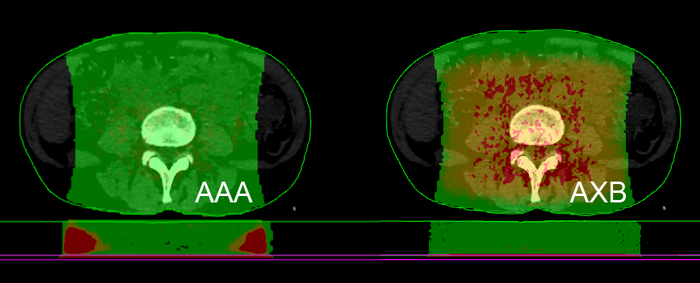
(GAM33 of the "scatter trumpet" at a z-position where dose has just dropped below 10%.)

(The inplane profiles in direct comparison.)
How to Improve the Original Plan
The big question is: How can we improve the original AXB plan to get higher plan quality (and possibly also a higher GAI)?
A good HD120 planning strategy for long targets is to rotate the collimator to high angles such as 70° or 75°. A minimum of two arcs is needed, because this time one arc has to "care about" the cranial part of the target alone, while the other arc covers the caudal part. The width of the central overlap zone depends on target length. In any case, the maximum leaf spread should be taken into account, which is 15 cm.
The Beams-Eye-View of the next image displays the CW arc which covers the cranial part of the target. Collimator angles of the two arcs can be chosen to be equal, and jaw tracking should be used in any case3.
If the complexity of the target asks for a second arc to cover the same region, additional arcs can be added4.
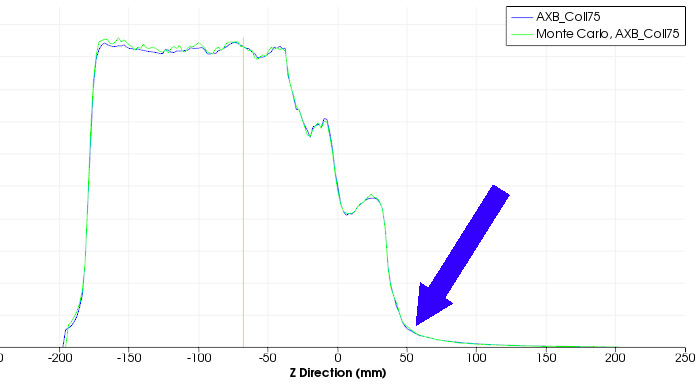
What is the result of the replanning? The first improvement is that dose drops much more rapidly in the region which had been a "scatter zone" in the original plan. The second improvement is that the agreement in VERIQA is much better. RT View profiles show perfect agreement in the former problem area (arrow):
The Beams-Eye-View of the CW arc illustrates the massive shielding (dark blue leaves), which is responsible for the sharp dose dropoff in the cranial direction:
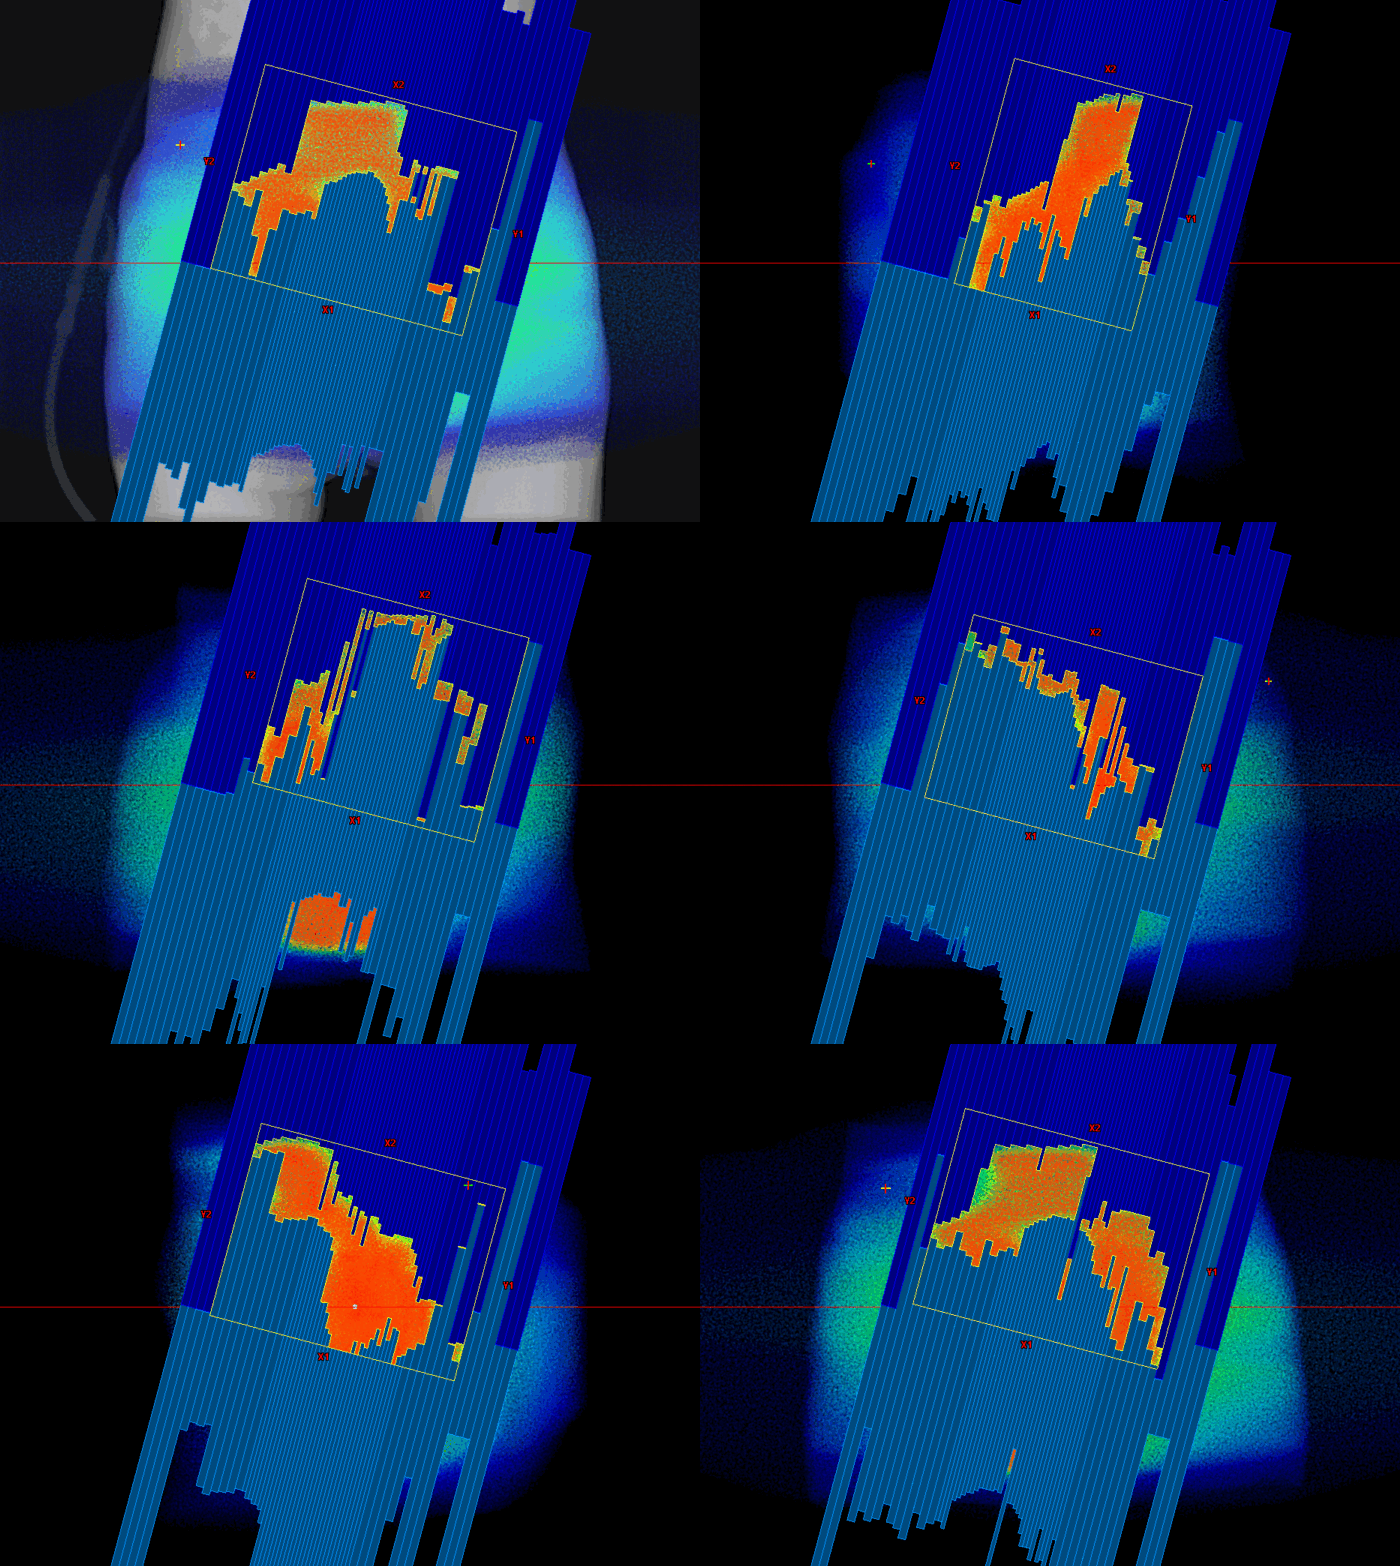
(The CW arc of the improved plan delivers dose to the cranial part of the target and shields healthy tissue beyond.)
Summary: Ways to Solve the "Problem"
As we have seen, there are several ways how the GAI can be improved for the plan:
- Evaluate the same plan with a different GAM33 template: as already mentioned, we could increase the VERIQA dose threshold from 5% to 10%, because in this dose region, we collected most of the failed voxels in the Gamma statistics. This would increase the GAI33 from 95.52% to 99.76%. However, raising the bar would hide the effect, not remove it.
- Switch from AXB to AAA (recalculate plan, no reoptimization): GAI33 will improve to 99.54% (GAI22 = 96.12%)
- Keep AXB, but change the arc setup to high collimator angles: as we have seen in the example, rotating the collimator to 75° reduces cranial and caudal out-of-field dose significantly. GAI33 = 99.95% (GAI22 = 98.34%) -> BEST CHOICE!
We want to make clear that a dose threshold of 5% is very low. In the PTW document which describes VERIQA Acceptance Tests, the recommended threshold for comparisons to patient anatomy is 10%.
Notes
1 We will focus on the cranial side. The situation at the caudal side is similar.
2 This also means that if we had our Gamma protocols set up with a threshold level of 10% instead of 5% maximum compared dose (= MC dose), this region would not have been evaluated.
3 We always use jaw tracking, except for extremely small fields. Here we are far from that.
4 If possible, we always try to find a solution with only one isocenter.
