Introducing FIELDCHECKepid
Modern radiotherapy techniques are characterized by high precision image guidance and surface scanners. The light field, which in the old days was regularly used to position the treatment field on the patient during clinical setups, loses more and more of its importance for the treatment quality on a radiotherapy machine1.
However, national and international standards for machine QA, which are always a little behind reality, still require that the coincidence of light field and radiation field has to be checked on a regular basis.
FIELDCHECK and FIELDCHECKepid
The FIELDCHECK test object from PTW (T40052, see our equipment page) is normally used in combination with a STARCHECK or STARCHECKmaxi ionization chamber array. The FIELDCHECK is placed on top of the STARCHECK, which then measures the radiation field. An algorithm published by Thijs Perik, which was implemented in PTW's MultiCheck software, extracts information about the light field from the STARCHECK measurement.
For the measurement, the Gantry must be in the upright position. Our national standard (ONORM S 5290-1) however requires that the check also has to be performed at Gantry 90° or 270°. But lateral beams cannot be measured with the STARCHECKmaxi.
One way to solve the problem is presented here. It keeps the FIELDCHECK test object, but replaces the STARCHECK by the TrueBeam's MV imager (EPID).
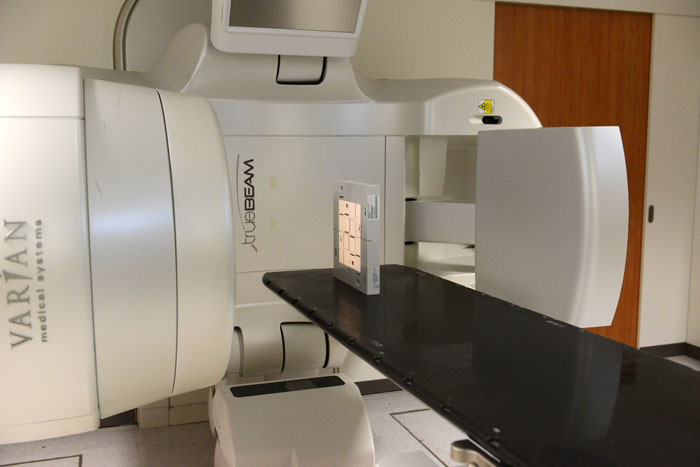
(Setup at Gantry 270°. The lateral beam crosses FIELDCHECK and hits the EPID on the right.)

(Testing at Gantry 0°. A 15X integrated image of the FIELDCHECK is acquired.)
Radiation Field and Light Field
How are light and radiation field extracted from the STARCHECK measurement or the EPID image anyway?
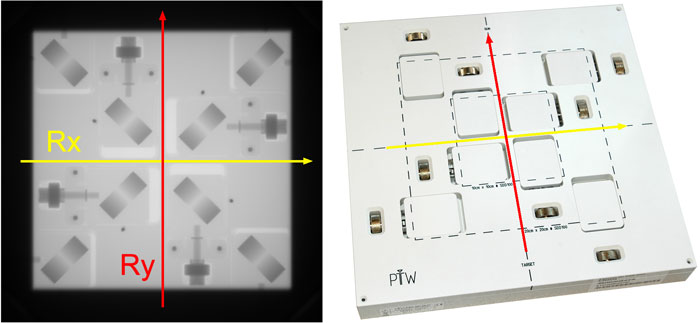
The radiation field is very straightforward. On the two major axes, inplane and crossplane, the FIELDCHECK provides a corridor which is wide enough to allow profile measurements without disturbances. We call the crossplane (or transveral profile) Rx. On the TrueBeam, it is shaped by the X-jaws (assuming the collimator is at 0°). The inplane or radial profile is therefore called Ry:
The FIELDCHECK is homogeneous along this corridor, so the measured profiles, no matter what the measurement device is, will have the expected shape.
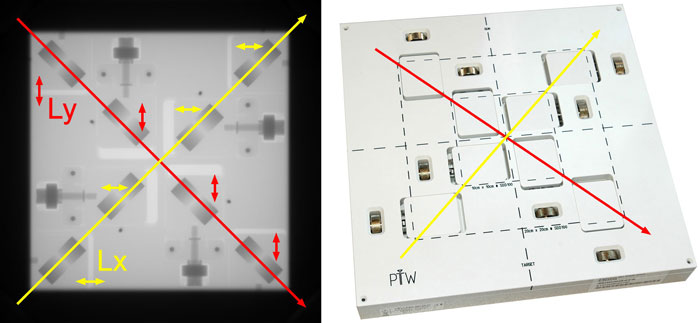
The light field on the other hand is a little special. It is extracted from the diagonal profiles in the following way (the ESTRO poster of Thijs Perik explains the principle as implemented in MultiCheck).
The white blocks of the FIELDCHECK can be adjusted either in the inplane or in the crossplane direction (double arrows), by turning the knurled screws with a finger. The full travel range of each block (end to end) is about 8.5 mm. The air gaps between the blocks and the phantom body show up as lighter bars on the MV image. For a 20x20 cm field, the position of the four inner blocks is irrelevant:
The outer two blocks on the yellow profile move in the crossplane direction whereas the outer two red blocks can be moved inplane. Therefore, one can say that the yellow diagonal represents the crossplane light field whereas the red diagonal represents the inplane light field.
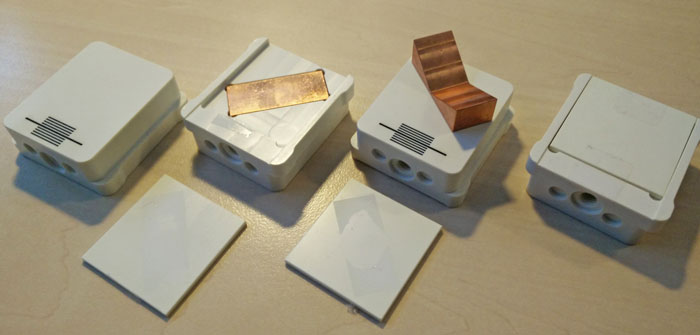
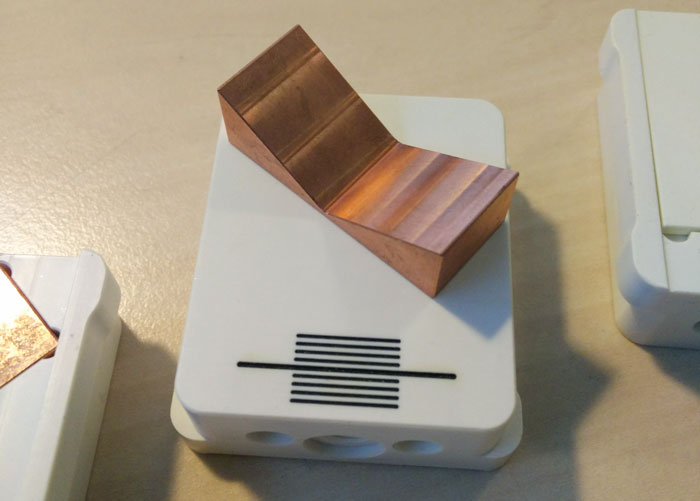
After this page had been online for a few weeks, an attentive reader of this blog, Thijs Perik, contacted us and kindly provided the following two photos, which are from the prototyping phase during FieldCheck development:
The wedges (presumably made of copper) give the characteristic peaks on the measured profiles.
In the final product, the white blocks cannot be opened anymore, so these photos offer a unique view!
FIELDCHECK is originally designed to be used together with a STARCHECK. The distance from focus has to be adjusted so that isocenter is 8.5 mm behind the backside of FIELDCHECK, because this is where the reference plane of STARCHECK would be. In other words, the correct table height with Gantry 0° is 999.15 cm, which means the table surface is 8.5 mm above isocenter.
After setting up the phantom on the linac couch and switching on the light field, the knurled screws are used to align the dashed line on the blocks perfectly with the four edges of the light field. If we then measure the radiation field or take an image with the EPID, we can extract the width of the light field (Lx) from the yellow diagonal profile which runs from bottom left to top right. The lower left block detects X1, the upper right X2. In the same way, the light field edge defined by the Y2 jaw connects with the upper left block and the Y1 light field edge with the lower right block.
FIELDCHECKepid - Advantages
Since our DMI upgrade in December 2015, we enjoy the high spatial resolution, the excellent dose linearity and longterm stability of our "solid state 2D dosimetry system". And what is good enough for patient plan dosimetry, should also be suitable for linac QA.
If one measures the diagonal profile directly on the TrueBeam console right after image acquisition, it looks like this:
This is nice, but of course it does not give any quantitative results regarding the light field. So we cannot use it. But at least one can see that the four peaks of the profile are purposefully shaped and should be easily detectable by special software. And the spatial resolution is more than sufficient: While the STARCHECKmaxi has 190 ionization chambers on the whole diagonal axis (which means that there are only a few points on each side of the peak available for fitting), the number of measurement points on our FIELDCHECKepid solution is 2379, as we will see later. This is a factor of 12.5.
The second main advantage of our EPID approach is that the FIELDCHECK can be positioned upright on the couch without problems. This makes it possible to measure lateral beams:
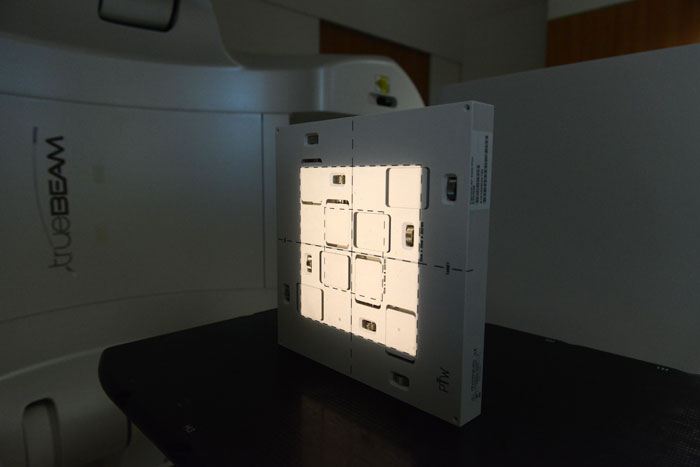
(FIELDCHECK stands like the monolith at Clavius Base.)
The MATLAB script
FIELDCHECKepid uses a very simple MATLAB script to evaluate the DICOM image which represents the measurement (we export the image from OfflineReview). With the MATLAB functions dicominfo() and dicomread(), important information like the acquisition energy and the vertical table height are read from the image, as well as the image pixel data itself. If the object is at isocenter, the pixel-to-mm conversion can be computed from the ImagePlanePixelSpacing, the RadiationMachineSAD and the RTImageSID2. These values can be read from the DICOM file.
The table height can be used for automatic image scaling or simply warning the user if the table height was too far off. This is important, because the size of the light field depends on distance, and FIELDCHECK is designed for a fixed SSD. The energy information is used to apply energy-dependent calibration factors.
From the image pixel matrix, we measure the radiation field profiles directly, in a straightforward way. After normalizing the profiles to CAX, the position of 50% dose is determined and declared as radiation field edge.
The TrueBeam's MV imager position offset is verified on a daily basis via MPC and has never been larger than 0.3 mm. It is therefore safe to assume the imager is centered at the beam axis. We simply take the absolute center rows and columns of the image matrix and measure the radiation profiles there. To improve SNR, we use a profile which is four pixels wide. One pixel has a size of 0.21 mm at isocenter distance. The square image matrix has a size of 1190 x 1190 px.
The diag() function is used to extract the diagonal profile. On a square matrix, the number of elements on the main diagonal is the same as the number of row or column elements (here: 1190). To improve SNR, one cannot simply add side diagonals to the main diagonal and average in the same way as above, because every odd side diagonal is offset by half a pixel in profile direction.
The principle of averaging on a diagonal profile is shown here. Assuming a matrix of 8 x 8, the pixel values of the matrix elements which have the same number are averaged.
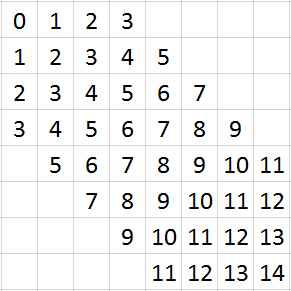
The elements with the numbers 1, 3, 5, ... are centered between grid points on the main diagonal, which suggests to double the resolution on the diagonal axis. This is the reason why the spatial resolution on the diagonal profiles (2379 px) is higher by a factor of 2 than in the main axis (1190 px). The number of diagonal profile points is odd, because one pixel (number 7 in the example) is centered on CAX, whereas on the major axes, CAX sits between the two central pixels.
In any case, there are plenty of measured points around the peaks, so the next task will be to accurately determine the position of the peaks.
Finding the Peaks - the Tangents Method
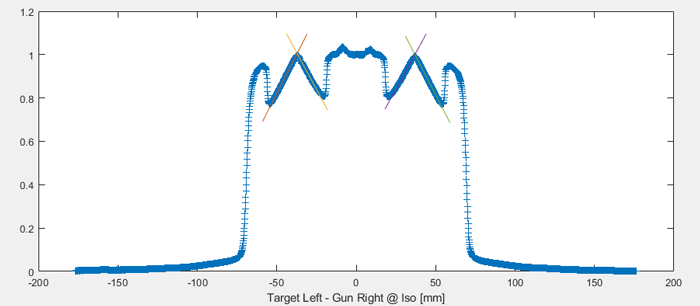
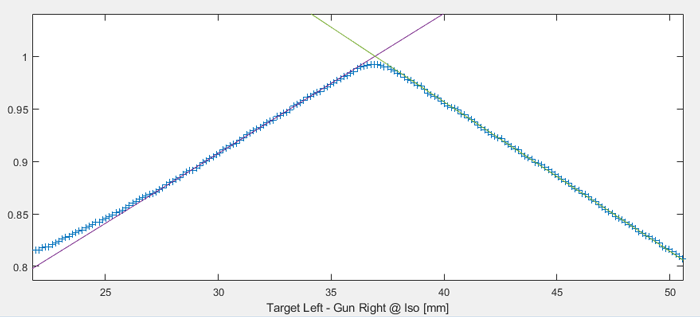
To find the exact peak location, we experimented with two approaches. The first tries to reproduce the method sketched on the ESTRO poster. The MATLAB script has to know the field size, which is either 10x10 or 20x20 cm. We include the field size in the file name of the DICOM image, because the DICOM data do not contain this information (remember that is an image, not a plan file). The script automatically puts tangents on both sides of the expected peak position:
The script uses linear fits in the expected region, which are described by a linear equation. The intersection point of the two tangents is calculated and gives the location of the peak:
As one can see, there are plenty of points around the peak, which should give a good fit.
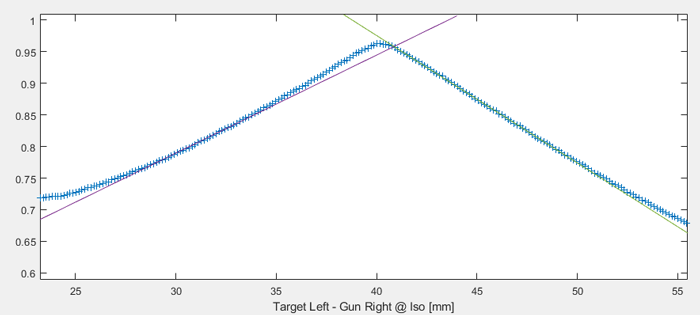
However, in extreme positions of the movable blocks, we found that the peaks can a little skewed. This makes it difficult to place the tangents if a fixed section of the full profile is used for the fitting. The next image shows the same 6X, 10x10 field as above, but with the block on the X2 side opened to maximum. The intersection point is too far right:
In the case of skewed peaks and when tangents are used, the selection of the part of the profile which is used for fitting is crucial. This is the case if the slope on either side of the peak is not linear.
One way to solve the problem could be a two step peak finding process. In the first step, one could locate an approximate peak position, which is only used to determine the part of the curve which is used for fitting. In the second step, the fits are performed and from the intersection of the tangents, the peak position is calculated, as above. The resulting tangents should give a better approximation of the exact location of the peak.
Finding the Peaks - the Smoothing Spline Method
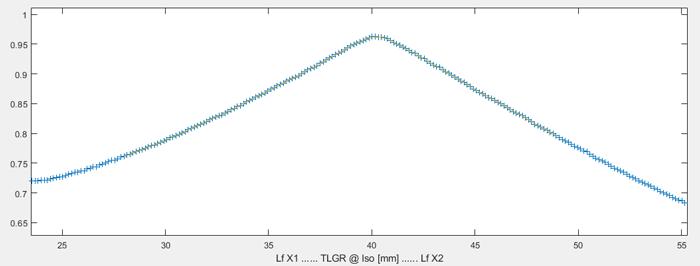
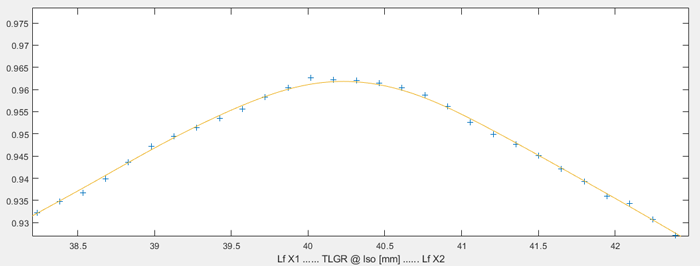
Instead of improving the algorithm, we gave up tangents completely and switched to smoothing splines. This is the same peak as before (extreme block position). The fit is so good that it is hard to distinguish it from the data points:
Higher magnification reveals the summit. There is still a certain amount of noise, but the fit is extremely robust under all circumstances.
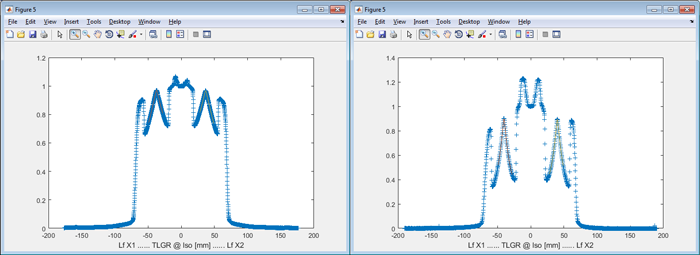
The smoothing spline fit also works for very sharp peaks, as we will see next. The left image is 6X integrated, the right is a 2.5X single image. The low energy of 2.5MV gives high image contrast (this is what 2.5X was designed for):
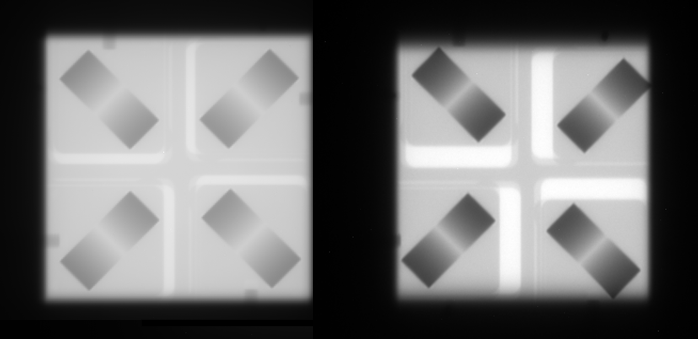
The corresponding diagonal profiles look like this:
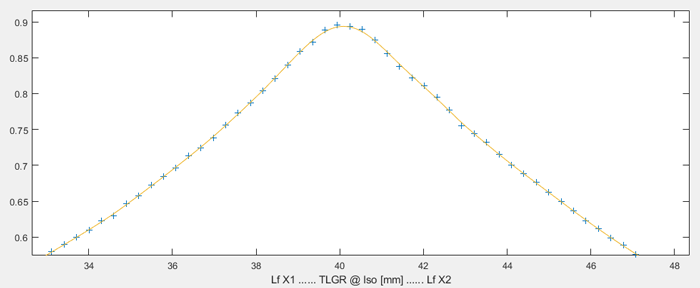
There is no FIELDCHECK peak which is sharper than the one at 2.5X, because there is no lower MV energy. Even here, the fitting works perfectly:
Although it is a single shot image with less than 1 MU (in contrast to all the others, which were images integrated over 50MU), the noise in the 2.5X image is very low.
The continuous smoothing spline curve is finally sampled at small intervals. Using the max() function, the peak is located.
Getting the Final Results
There are some more steps until we get the final results of a typical evaluation. We regard the center of the imager as origin and assume that the FIEDCHECK was aligned correctly with the light field crosshairs of the TrueBeam. We report the size of radiation and light field (per jaw and as total field size), the asymmetry (shift of field center relative to matrix center), and the difference between the light and the radiation edge on each side:
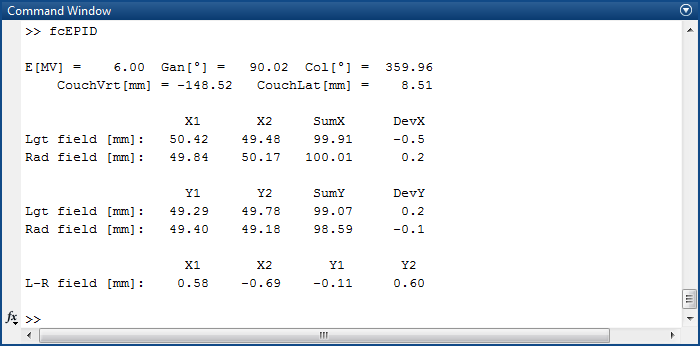
The steps that need to be done to get this result are basically about calibration. Why is calibration necessary? One reason is that on the diagonal profile (which is used to "measure" the light field), the peak positions are not at 50.0 or 100.0 mm. But we want to read such numbers as output for the light field. For a 20x20 field and if the FIELDCHECK is in "STARCHECK distance", about 50 mm have to be subtracted from the raw position along the profile, whereas for a 10x10 field the correction is between 2 to 3 millimeters. This part of the calibration has its origin in the construction of the FIELDCHECK test object.
For calibrating light and radiation field, we currently do the following. We use STARCHECK distance and load a 10x10 cm MLC field. We adjust FIELDCHECK as precisely as possible, and acquire an image. The MLC is Varian's high precision field shaping component, so we use the MLC as reference. This image with collimator 0° serves for calibrating both light and radiation field in the crossplane direction. Another MLC field with collimator 90° is used to calibrate the inplane direction. The procedure is repeated with a pair of 20x20 MLC images. This is done for each energy.
Extended SSD
The Austrian standard S5290-1 requires that the check also has to be performed at 1.5 times the normal treatment distance (Gantry 0°, one energy, one field size). Two problems have to be solved:
- Up to now, the FIELDCHECK's distance from focus was fixed relative to a virtual STARCHECKmaxi with its reference plane at isocenter. This was also the reason why the table height was set to 999.15 cm, because then the FIELDCHECK backplane is at 8.5 mm above iso. We can no longer assume this geometry, because the FIELDCHECK can now be at any distance.
- A suitable (smaller) isocenter field size has to be found, so that the drawings on the FIELDCHECK surface can still be used to adjust the blocks to the light field at extended distances.
In the script, we can use the TableTopVerticalPosition from the image file to determine the position of the FIELDCHECK. With an if() statement, we enable the new logic only when the Gantry is at 0° (plus minus a small tolerance). For lateral beams, the table height cannot be used to determine the FIELDCHECK's distance from focus.
We would like to use the 20x20 cm drawing only. When the TrueBeam field size is set to 13x13 cm and the table surface is at 150.6 cm from focus (50.6 cm below isocenter), the width of the light field on the FIELDCHECK's surface (which is at 47 cm) is 13 cm * 1.47 = 19.11 cm, the same as when the check is performed at iso3.
The EPID can be moved down to 182 cm distance from focus (82 cm below isocenter). There is still plenty of space between the PerfectPitch carbon couchtop at 50.6 cm and the imager at 82 cm. With the DICOM data ImagePlanePixelSpacing (0.336 mm), RadiationMachineSAD (1000 mm), TableTopVerticalPosition (-506 mm) and RTImageSID (1820 mm), the pixel size in mm can be calculated and the check performed as usual:
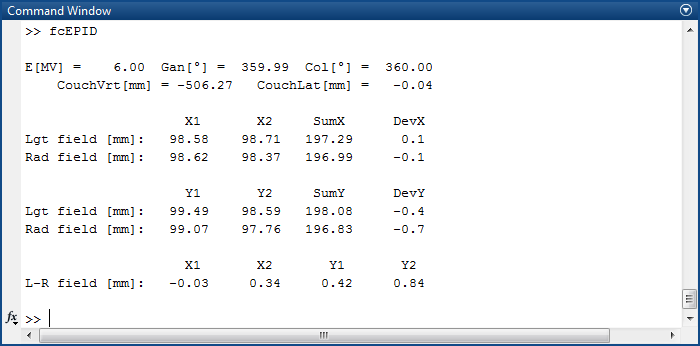
The per-jaw deviation between light field and radiation field (last line) at 150 cm from focus is still well below the Varian tolerance of 1.5 mm at isocenter.
Summary
For owners of the FIELDCHECK, FIELDCHECKepid offers an elegant solution to the problem of measuring light field/radiation field coincidence for vertical and lateral beams. It also allows checking at extended distances (150 cm). FIELDCHECKepid combines two high precision devices: the PTW FIELDCHECK test object and the Varian EPID.
However, one source for uncertainty remains: the human factor. As long as there is no QA device suitable for radiotherapy which actually measures the light field without the need of visual interpretation, the achievable accuracy remains limited. But as the importance of the light field for radiotherapy gradually shrinks over time, it is questionable whether the development of such a device would make sense.
Notes
1 Modern machines like the Varian Halcyon do not even have a light field any more.
2 The most common Source Imager Distance (SID) was 160 cm.
3 The thickness of the FIELDCHECK test object is 36 mm. This means that when the table surface is 8.5 mm above iso, the SSD on FIELDCHECK is 1000 - (36 + 8.5) = 955.5 mm. At this SSD, a 20 cm wide field projects as 19.11 cm.
